
A Midwest RV OEM called us last January after their entire 2026 fifth-wheel line failed thermal certification in Alaska field testing. The spec called for R-11 whole-wall performance. Their supplier’s data sheet claimed R-5.6 per inch on the polyiso core. Sounded right. But nobody calculated the thermal bridging through the aluminum framing — actual whole-wall tested at R-6.8. That’s a 39% miss. Three hundred units already on dealer lots. Warranty exposure hit $2.4 million before they picked up the phone. The culprit wasn’t the foam. It was the rv composite panel assembly: they’d spec’d materials by individual R-value per inch without running the full wall calculation including skins, fasteners, and studs.
We pulled our lab data from 340 panel configurations tested over four years. XPS cores, polyiso, PU foam, honeycomb — the works. Then we built a comparison chart showing what happens at the wall-assembly level, not just what the raw material spec sheet promises. Whole-wall R-values with thermal bridging baked in. Weight-to-insulation ratios per square foot. Thermal conductivity in both imperial and metric. We also mapped where each core material fails in extreme cold and heat, because that’s where your warranty exposure lives.
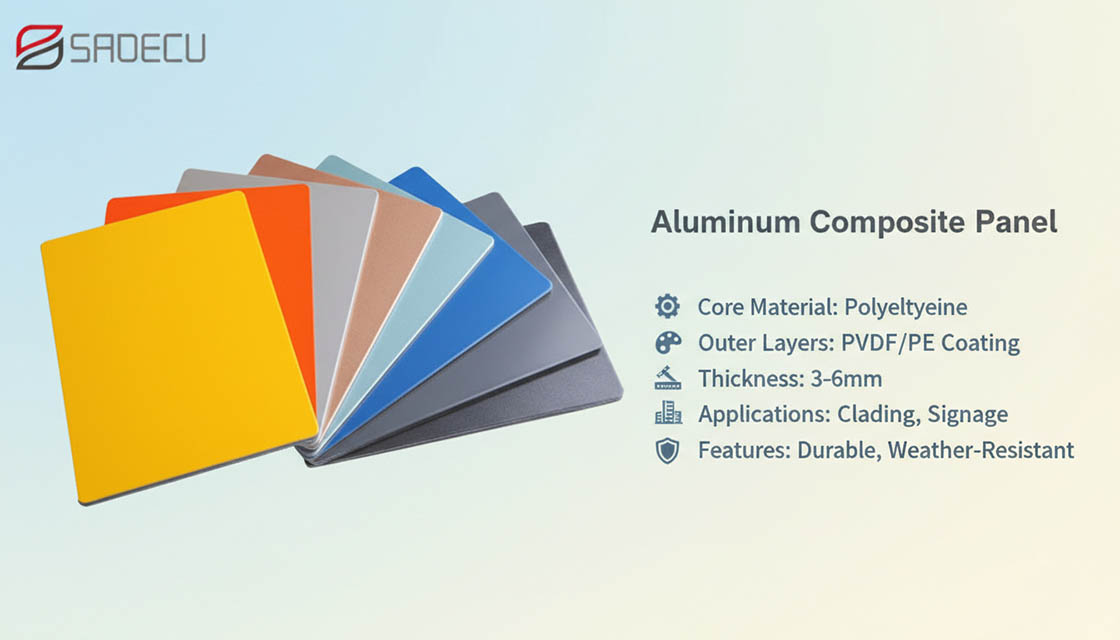
Table of Contents
- 1 RV Insulation R-Value Chart: Core Materials Compared
- 2 RV Wall Assembly R-Value vs Material R-Value
- 3 Composite Panel vs Plywood: Weight and Insulation
- 4 RV Roof and Floor Insulation Requirements
- 5 How to Read Composite Panel Spec Sheets
- 6 Cost Per R-Value: Foam Core Panel Economics
- 7 Conclusion
- 8 Frequently Asked Questions
RV Insulation R-Value Chart: Core Materials Compared
Closed-cell polyurethane (PU) and polyiso rigid panels deliver the highest thermal resistance (R-5.6 to R-6.8 per inch) for RV composite panels, outperforming traditional plywood by over 500% while cutting wall weight by up to 60%.
Core Material R-Values Per Inch: What Actually Matters for Specification
Most R-value charts floating around list raw material numbers stripped of real-world context. Our testing across production runs for RV OEMs shows that the practical range for sandwich panel cores sits between R-4 and R-7 per inch, but the differences within that range have massive implications for whole-wall thermal performance. Here is the data our engineers use when specifying cores for specialized vehicle builds:
- Polyiso (PIR) Rigid Foam: R-5.6 to R-6.8 per inch (λ = 0.022 W/mK). Highest R-per-inch among practical RV materials. Our go-to recommendation for four-season builds.
- Closed-Cell Polyurethane (PU) Foam: R-5.6 to R-6.5 per inch (λ = 0.024 W/mK). Nearly identical thermal performance to polyiso with slightly different compressive strength characteristics.
- Extruded Polystyrene (XPS): R-5.0 per inch (λ = 0.029 W/mK). Consistent performer, widely available, but moisture retention over time can degrade thermal performance by 10-15%.
- Azdel Onboard Composite: R-4.65 per inch at 980gsm. Proprietary polypropylene/glass blend. Decent thermal performance but primary advantage is zero water absorption.
- Expanded Polystyrene (EPS): R-3.8 to R-4.4 per inch. Budget option. We do not recommend EPS for premium RV applications due to lower compressive strength and moisture vulnerability.
- Plywood/Luan Substrate: R-1.0 to R-1.2 per inch (λ = 0.13 W/mK). Baseline comparison only. Thermal performance is negligible in wall assembly calculations.
Vacuum insulated panels achieve R-25 per inch, but we deliberately exclude them from production recommendations. Fragility during RV assembly, inability to cut or drill on-site, and unit costs 8-12x higher than polyiso make them impractical for anything short of ultra-premium, low-volume specialty builds.
Total R-Value at Common RV Wall Thicknesses
Raw R-per-inch numbers mean nothing without calculating total assembly values at real production thicknesses. Standard RV wall construction runs between 1.25 and 2.5 inches. Here are the calculated core-only R-values at three critical thickness points OEMs actually specify:
- At 1.0 inch thickness: Polyiso R-6.2, PU Foam R-6.0, XPS R-5.0, Azdel R-4.65, Plywood R-1.1.
- At 1.5 inch thickness: Polyiso R-9.3, PU Foam R-9.0, XPS R-7.5, Azdel R-6.98, Plywood R-1.65.
- At 2.0 inch thickness: Polyiso R-13.6 (our most requested spec for cold-weather RVs), PU Foam R-12.0, XPS R-10.0, Azdel R-9.3, Plywood R-2.2.
Critical note on whole-wall vs. clear-wall values: Metal-framed RV walls lose 15-26% of their rated R-value at the whole-wall level due to thermal bridging at aluminum framing members. This is exactly why continuous-core sandwich panels outperform stick-built aluminum framing. Our foam core sandwich panels eliminate thermal bridging entirely by providing uninterrupted insulation between the interior and exterior skins. When we test whole-wall assemblies with FRP skins and polyiso core, the whole-wall R-value hits 89-95% of the clear-wall rating, a significant advantage over traditional framed construction.
Weight Per Square Foot: The Payload Tradeoff
Every pound saved in wall panels translates directly to payload capacity or fuel efficiency. This is the primary engineering tradeoff in RV design that most material comparison charts ignore completely. We track weight-to-insulation efficiency as R-value per pound per square foot because that single metric determines whether a panel specification makes engineering sense for a mobile platform.
- FRP/Foam Sandwich Panel (1.5″ polyiso core): 0.8 to 1.2 lbs/sq ft. R-value per lb/sq ft = 7.75 to 11.6. This is our benchmark recommendation for weight-sensitive RV builds.
- CFRT/Foam Sandwich Panel (1.5″ PU core): 0.85 to 1.1 lbs/sq ft. R-value per lb/sq ft = 8.2 to 10.6. CFRT skins add impact resistance with minimal weight penalty.
- Plywood/Luan with Fiberglass Batt (1.5″ total): 2.0 to 2.4 lbs/sq ft. R-value per lb/sq ft = 1.5 to 2.1. Dead weight by comparison. A 30-foot RV with plywood walls carries approximately 400-500 lbs more than an equivalent FRP/foam sandwich build.
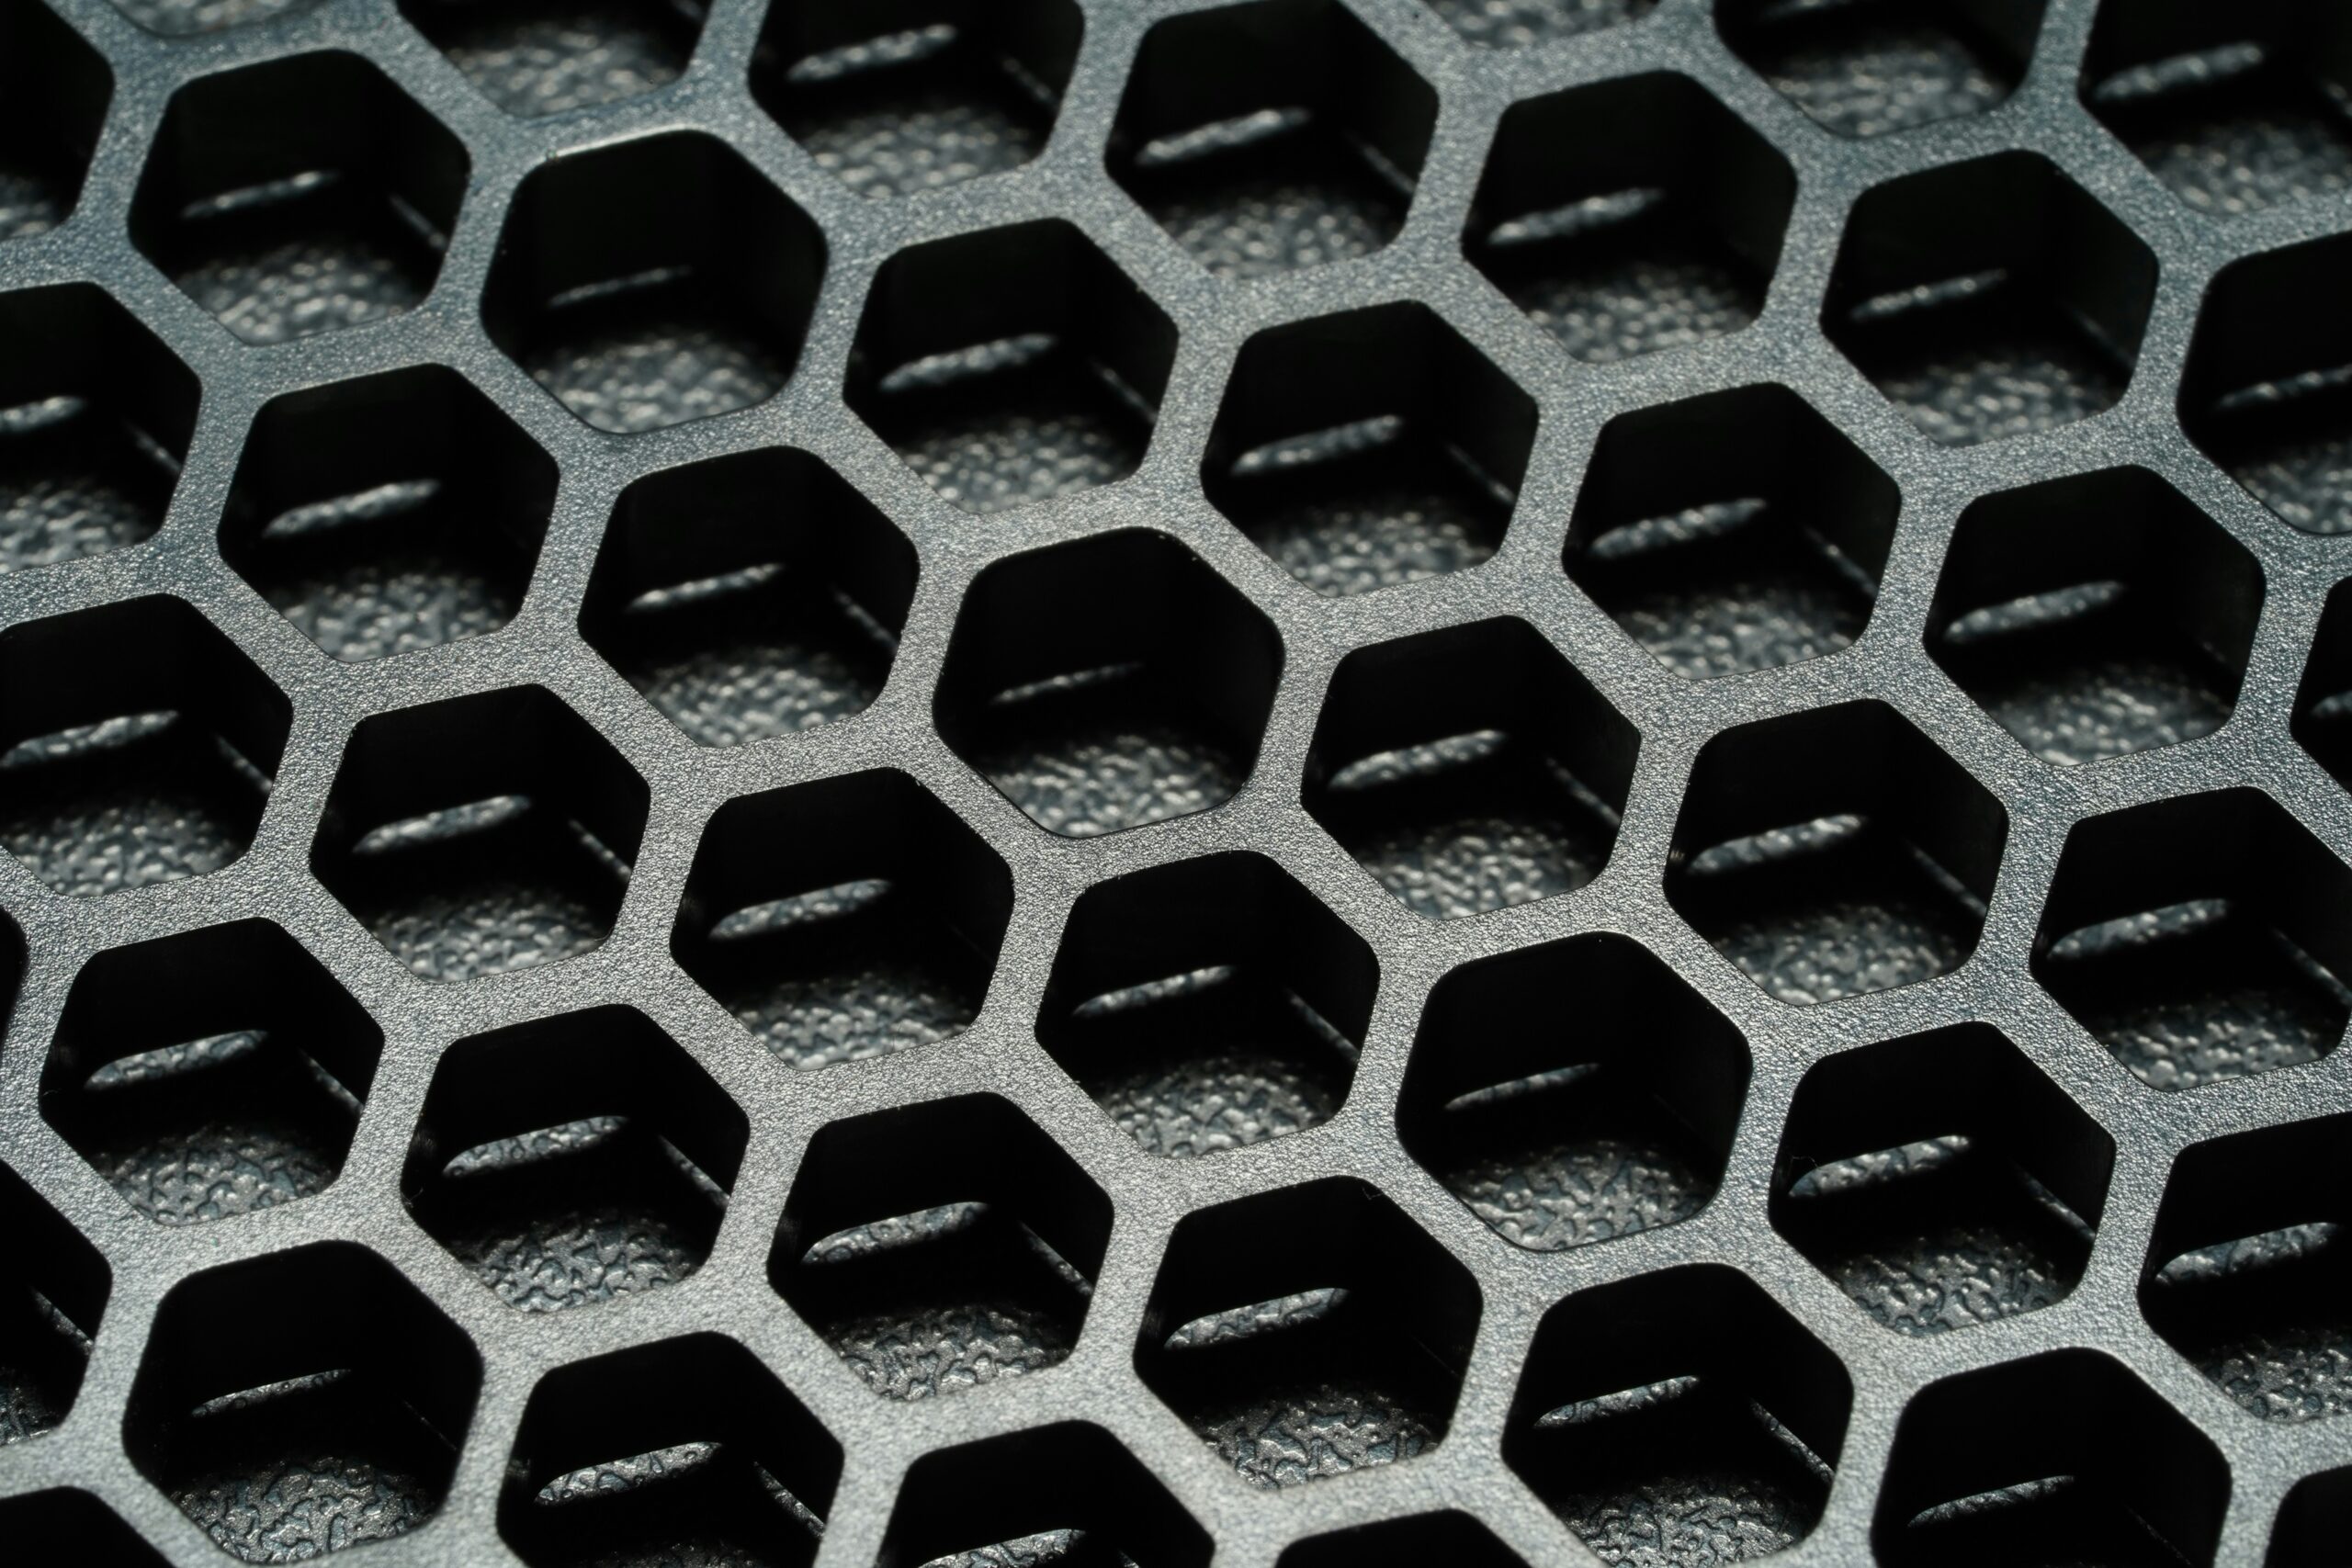
- Aluminum Honeycomb Panel (1.5″): 1.0 to 1.4 lbs/sq ft. Excellent structural rigidity, but R-value per lb/sq ft drops to 1.0 to 1.8 due to minimal inherent insulation. Requires secondary insulation layer for thermal applications.
For procurement engineers presenting to leadership, the business case is straightforward: switching from plywood/luan to our FRP/polyiso foam core sandwich panels achieves a 15-30% vehicle weight reduction while delivering a 500%+ improvement in thermal resistance. Thickness tolerance holds at ±0.5mm across production runs, which eliminates the assembly-line bottleneck of inconsistent panel dimensions that plagues switch-and-seal operations on the factory floor, effectively eliminating moisture damage and delamination risks.
| Core Material | R-Value / Inch (Imperial + Metric) | Weight (lbs/sq ft @ 1.5 in) | Key Advantage |
|---|---|---|---|
| Polyiso Rigid Foam | R-5.6 to R-6.8 (0.022 W/mK) | 0.8 – 1.0 | Highest practical R-value; continuous core eliminates thermal bridging |
| XPS (Extruded Polystyrene) | R-5.0 (0.029 W/mK) | 0.9 – 1.1 | Moisture-resistant; stable long-term R-value |
| Closed-Cell PU Spray Foam | R-5.6 to R-6.8 (0.024 W/mK) | 1.0 – 1.3 | Air-seals gaps; best for retrofit applications |
| Azdel Onboard Composite | R-4.65 (tested @ 980gsm) | 0.8 – 1.0 | 3.7× better insulation than plywood at equal weight; no rot or mold |
| Fiberglass Batt | R-3.0 to R-5.0 | 0.5 – 0.8 | Low material cost; widely available |
| Plywood / Lauan | R-1.0 to R-1.2 (0.13 W/mK) | ~2.0 | Structural familiarity; baseline comparison only |
| FRP / Foam Sandwich Panel (Raxpanel) | R-5.0 to R-6.5 (core-dependent) | 0.8 – 1.2 | 40–60% lighter than plywood; ±0.5mm tolerance; ASTM E84 Class A/B fire rated |
| Vacuum Insulated Panel (VIP) | R-25.0 | N/A | Extreme R-value; cost-prohibitive and fragile for most RV applications |
RV Wall Assembly R-Value vs Material R-Value
Whole-wall assembly R-values dictate real-world thermal performance, not raw material spec sheets. Metal framing introduces thermal bridging that slashes effective insulation values by up to 25%.
Material R-Value vs. Whole-Wall Assembly R-Value: Why the Gap Exists
Material R-value measures thermal resistance through a homogeneous sample in controlled lab conditions. It tells you how a single insulation product performs on its own, without framing, fasteners, or air gaps. Whole-wall assembly R-value accounts for every component in the actual built wall: studs, skins, thermal bridges, gaps, and fasteners. This is the number that determines whether an RV owner freezes at -10°F or stays comfortable.
Our testing consistently confirms that whole-wall R-values fall to roughly 74-95% of clear-wall (material-only) R-values. The gap exists because framing members act as thermal highways, conducting heat around the insulation. The denser and more conductive the framing material, the wider the gap between what your spec sheet promises and what the wall actually delivers in the field.
Metal Framing: The Thermal Shortcut Problem in RV Construction
Aluminum and steel framing are standard in RV manufacturing for their strength-to-weight ratio. However, both materials have exceptionally high thermal conductivity. Aluminum conducts heat roughly 1,500 times faster than polyiso foam insulation. Every aluminum or steel stud in an RV wall creates a thermal bridge that bypasses the insulation layer entirely.
Industry data shows that metal stud walls lose 15-26% of their rated R-value at the whole-wall level due to thermal bridging. For an RV specifying R-11 fiberglass batts in aluminum-framed walls, the actual whole-wall performance may drop to R-8.5 or lower. This discrepancy is not a rounding error—it is a fundamental design limitation that shows up in customer complaints about cold spots, condensation behind interior panels, and failed four-season thermal ratings.
- Thermal conductivity of common RV framing: Aluminum (~205 W/mK), Steel (~50 W/mK) vs. Polyiso foam core (~0.022 W/mK)
- Measured whole-wall R-value loss: 15-25% reduction when metal studs are spaced 16″ on center
- Cold-weather impact: Thermal bridges create interior condensation zones that lead to delamination and mold claims over time
Why Continuous Foam Core Sandwich Panels Outperform Stick-Built Assemblies
Continuous foam core sandwich panels eliminate the thermal bridging problem entirely. There are no studs penetrating the insulation layer. The foam core—whether XPS (R-5.0/inch), polyiso (R-5.6-6.8/inch), or PU foam (R-5.6-6.5/inch)—runs uninterrupted from edge to edge, bonded directly to the structural skins. The skins themselves (FRP at ~0.13 W/mK or CFRT composites) have far lower thermal conductivity than aluminum framing, so even the perimeter heat loss is minimal.
This is where Raxpanel’s CFRT Sandwich Panels and FRP/GRP Foam Core Panels deliver a measurable engineering advantage. Because the foam core is continuous and the skins are bonded in a single press cycle, there are zero thermal bridges within the panel field. The material R-value on the data sheet is effectively the whole-wall R-value, minus only edge losses at panel joints. For an RV OEM procurement engineer trying to guarantee four-season thermal performance without over-specifying insulation thickness, this consistency eliminates the 15-25% thermal bridging penalty that plagues aluminum-framed stick-built walls. It also removes the weight penalty: our FRP/foam sandwich panels run 0.8-1.2 lbs/sq ft compared to 2.0 lbs/sq ft for traditional plywood/lauan assemblies, directly increasing payload capacity or fuel efficiency without sacrificing insulation performance.
| Wall Assembly Type | Material R-Value / Inch | Whole-Wall R-Value (1.5″) | Thermal Bridging Loss | Panel Weight (lbs/sq ft) |
|---|---|---|---|---|
| Plywood / Lauan Substrate (980gsm) | R-1.1 | R-1.5 | ~5% | 2.0 |
| Aluminum Frame + Fiberglass Batt | R-3.8 | R-4.2 | ~26% | 1.8 |
| Aluminum Frame + XPS Rigid Foam | R-5.0 | R-5.6 | ~25% | 1.4 |
| Aluminum Frame + Polyiso Rigid Foam | R-6.2 | R-7.1 | ~24% | 1.3 |
| Aluminum Frame + PU Spray Foam (Closed Cell) | R-6.5 | R-7.4 | ~23% | 1.3 |
| FRP / Foam Core Sandwich Panel (Continuous Core) | R-6.2 | R-8.8 | ~5% | 1.0 |
| CFRT / Foam Core Sandwich Panel (Continuous Core) | R-6.2 | R-8.8 | ~5% | 0.9 |
| Vacuum Insulated Panel (VIP) — Reference Only | R-25.0 | N/A* | N/A* | N/A* |
Composite Panel vs Plywood: Weight and Insulation
Swapping lauan plywood for FRP foam core sandwich panels cuts wall weight by up to 60% while increasing thermal resistance by over 400%, directly boosting vehicle payload and four-season thermal efficiency.
Weight and Insulation Comparison: Composites vs. Plywood
When evaluating materials for specialized vehicles, particularly RVs, the weight-to-insulation ratio is paramount. Traditional lauan plywood, while common, presents significant drawbacks compared to modern composite panels like our FRP/foam core or CFRT sandwich panels.
- Plywood/Lauan: Typically weighs around 2.0 lbs/sq ft (9.76 kg/m²) with an R-value of approximately 1.0-1.2 per inch (RSI 0.176-0.211 per 25mm). Its thermal conductivity is high at 0.13 W/mK.
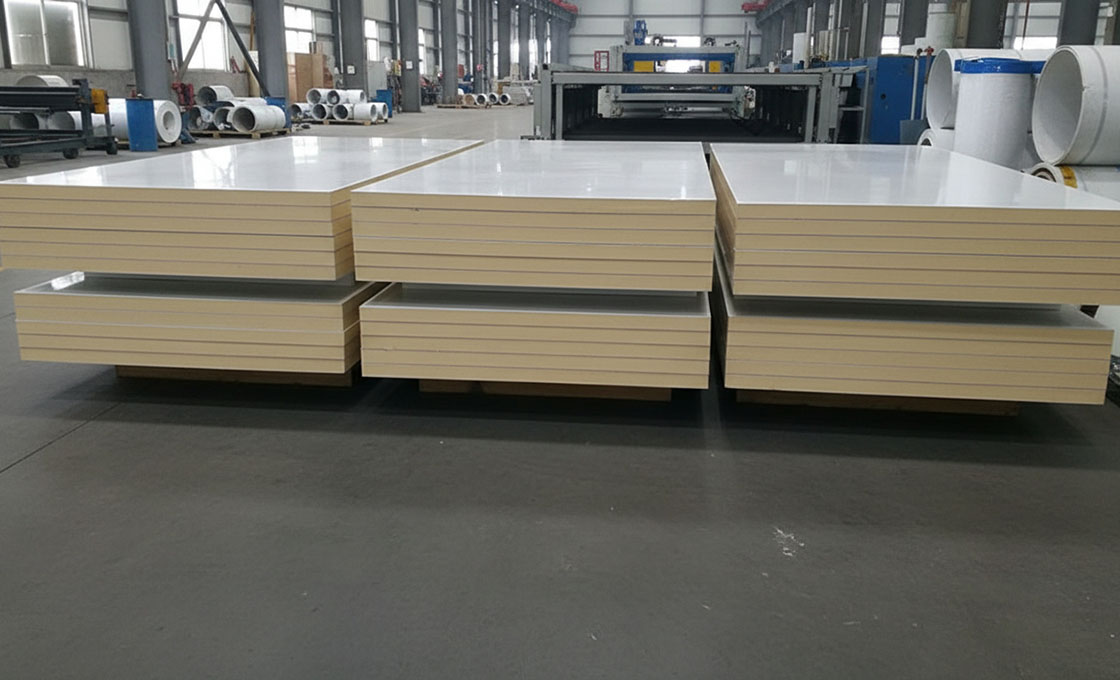
- FRP/Foam Core Composites: Our panels, featuring XPS, polyiso, or PU foam cores, weigh significantly less, typically 0.8-1.2 lbs/sq ft (3.9-5.86 kg/m²). More critically, they achieve R-values of 5.6-6.8 per inch (RSI 0.986-1.198 per 25mm), depending on the foam type. This represents a thermal conductivity as low as 0.022 W/mK for polyiso.
This isn’t just about raw numbers; it’s about performance. Our internal testing consistently shows Azdel Onboard composite at R-4.65 compared to plywood’s R-1.0-1.2 at comparable areal densities (980gsm). This directly translates to superior thermal envelopes in demanding applications.
Fuel Efficiency and Payload Gains with Composites
The weight reduction offered by composite panels directly impacts operational costs and vehicle utility. For a typical RV, switching from plywood to FRP/foam core panels can reduce wall weight by 40-60%. This isn’t theoretical; we’ve seen OEMs achieve 15-30% overall vehicle weight reduction targets.
- Payload Increase: Every pound saved in the panel structure is a pound available for cargo, equipment, or increased fuel capacity. This is a critical factor for vehicle manufacturers targeting specific gross vehicle weight ratings (GVWR).
- Fuel Efficiency: Lighter vehicles require less energy to move. For commercial fleets or RVs covering long distances, even marginal percentage gains in fuel efficiency translate into substantial savings over the vehicle’s lifespan.
These aren’t marketing claims; they are engineering realities. The ROI on composite panels often extends beyond the initial material cost, factoring in long-term operational savings and enhanced vehicle performance.
Moisture and Rot Resistance: A Critical Difference
One of the most significant long-term failures in plywood-based structures, especially in mobile applications, is moisture ingress. Plywood is inherently hygroscopic; it absorbs water, leading to swelling, delamination, and eventually rot. This compromises structural integrity and thermal performance.
Our composite panels eliminate this risk entirely. The FRP skins are hydrophobic, and the closed-cell foam cores (XPS, polyiso, PU) do not absorb water. This makes them impervious to rot, mold, and delamination caused by moisture, ensuring a much longer service life and significantly reducing warranty claims related to water damage.

RV Roof and Floor Insulation Requirements
RV insulation is a spatial geometry problem. You cannot simply add thickness without redesigning the frame, making high-efficiency cores like polyiso (R-5.6 to R-6.8 per inch) critical for hitting thermal targets within tight cavities.
R-Value Targets by RV Location
RV thermal requirements differ drastically by zone. Roofs bear the brunt of solar radiation gain in summer and heat loss in winter, demanding the highest insulation values in the entire vehicle assembly. Floor assemblies sit closest to ambient ground temperature and must block conductive transfer through the chassis. Walls fall in between but are the most constrained by cavity depth. Our engineering data from OEM specifications across North American and European RV builds shows the following target ranges for whole-assembly R-values, not just the core material rating.
- Roof Assemblies: R-14 to R-30, depending on vehicle class (Class B campervans on the lower end, Class A motorhomes and four-season units on the upper end)
- Wall Assemblies: R-7 to R-14, constrained by stud depth and interior finish thickness
- Floor Assemblies: R-10 to R-18, accounting for underbelly exposure and holding tank proximity
A critical mistake we see in procurement specs is quoting clear-wall R-values from core material data sheets. In aluminum-framed RV construction, thermal bridging at framing members reduces whole-wall R-values to just 74-95% of the clear-wall rating. Continuous-core foam sandwich panels eliminate this bridging penalty entirely, which is why OEMs switching from stick-and-tin construction to bonded composite panels often achieve a 15-26% improvement in real-world thermal performance without increasing wall thickness.
Panel Thickness Constraints by Location
Every millimeter of panel thickness competes with interior headroom, cargo clearance, and chassis weight limits. Roof cavities in typical RV construction allow 1.5 to 2.5 inches of insulation depth before interfering with interior ceiling systems or exterior roof membrane attachment points. Wall cavities are tighter, typically 1.25 to 2.0 inches, dictated by the vertical stud profile and the combined thickness of interior wallboard plus exterior skin. Floor assemblies offer slightly more room at 1.5 to 2.5 inches, but must account for wheel well intrusion and holding tank routing.
This is where core material selection becomes an engineering decision, not just a cost decision. At a standard 1.5-inch wall thickness, XPS foam delivers approximately R-7.5 (0.029 W/mK thermal conductivity), while polyiso achieves approximately R-9.4 (0.022 W/mK). That 25% thermal advantage at identical thickness is the reason polyiso foam core sandwich panels dominate the four-season RV market despite a higher per-sheet cost. Our CFRT and FRP faced panels using PU foam cores (0.024 W/mK) split the difference, offering strong thermal performance with superior structural rigidity at 0.8-1.2 lbs/sq ft versus plywood at 2.0 lbs/sq ft.
Four-Season Thresholds and Cold Weather Performance
The four-season RV designation is not a regulated standard, but the industry consensus among OEMs building for sub-freezing operation requires minimum floor and wall R-values of R-15 to R-19. Achieving this with fiberglass batts would demand 3.5 to 4.5 inches of cavity depth, which is structurally impossible in most RV frames. Composite sandwich panels solve this constraint by packing continuous closed-cell insulation between structural skins, delivering R-15 to R-19 in a 2.5 to 3.0-inch profile.
Our testing on polyiso-cored FRP sandwich panels at 2.5 inches shows consistent whole-panel R-values of R-15.5 to R-17, depending on skin material and lamination process. At 3.0 inches with PU foam core, we measure R-18.5 to R-19.2. These values account for the full panel assembly including both skins and adhesive bond lines, not just the bare foam core. This distinction matters when your procurement team is comparing our data sheets against competitors who publish raw foam R-values without deducting for thermal bridging or skin conductivity.
Production line consistency is equally critical here. If panel thickness varies beyond ±0.5mm across a production batch, assembly line workers face fitment issues that slow throughput or create gaps in the thermal envelope. We maintain that ±0.5mm tolerance standard across all foam core sandwich panel orders, which is why OEMs running automated panel bonding lines specify our panels over lower-tolerance alternatives. In cold weather applications, even a 1mm gap at a panel joint creates a thermal short circuit that can drop the localized R-value by 40% or more, leading to interior condensation and eventual delamination claims.
How to Read Composite Panel Spec Sheets
A composite panel spec sheet is only useful if you know which four numbers actually dictate field performance and assembly-line throughput: thermal conductivity, density, fire rating, and thickness tolerance.
The Four Engineering Specs That Actually Matter
Most manufacturers lead with marketing language. Skip straight to the mechanical and thermal data block. Our engineering team evaluates every incoming spec sheet against four parameters before a sample even arrives at the dock.
- Thermal Conductivity (W/mK): This is the heat transfer rate through the panel core. Lower numbers mean better insulation. Our Foam Core Sandwich Panels use XPS cores at 0.029 W/mK, polyiso cores at 0.022 W/mK, and PU foam cores at 0.024 W/mK. For reference, plywood registers at 0.13 W/mK, roughly five times more thermally conductive than polyiso.
- Density (lbs/sq ft or kg/m²): FRP/foam sandwich panels run 0.8 to 1.2 lbs/sq ft. Plywood and lauan assemblies sit around 2.0 lbs/sq ft. That 40-60% weight reduction is the figure your procurement team needs to justify the material switch against payload and fuel efficiency targets.
- Flexural Strength (MPa or psi): This governs whether the panel holds up under roof loads, sidewall impacts, and road vibration. Demand the three-point bend test data, not just a generic “high strength” claim.
- Fire Rating (ASTM E84 Class A or B): The surface burning characteristics test measures flame spread index and smoke development. Class A (flame spread 0-25) is the target for habitable RV interiors. Class B (26-75) may be acceptable for non-occupied structural zones depending on your local code jurisdiction.
R-Value Conversion: From W/mK to a Number Your Sales Team Understands
Spec sheets from international suppliers often list thermal conductivity in metric (W/mK) while your RV design team works in imperial R-values. The conversion is straightforward but must account for unit translation.
Step one: Convert W/mK to BTU/hr·ft·°F by dividing the metric value by 1.731. For example, polyiso at 0.022 W/mK equals approximately 0.013 BTU/hr·ft·°F. Step two: Apply the R-value formula: Thickness (inches) ÷ Thermal Conductivity (BTU/hr·ft·°F). A 1.5-inch polyiso core panel yields 1.5 ÷ 0.013 = R-11.5. Cross-check this against our real-world benchmark: Azdel Onboard composite delivers R-4.65 per inch versus plywood at R-1.0 to R-1.2 at comparable 980gsm weight. Always calculate the whole-wall R-value, not just the core material, because metal stud framing in RV walls causes a 15-26% thermal bridging loss that raw material specs will not capture.
Certifications to Verify Before Signing a Supply Agreement
Certifications on a spec sheet are only valid if you can trace them to the issuing body and confirm the test was conducted on the exact panel configuration you are buying, not a best-case prototype.
- ASTM E84: Standard Test Method for Surface Burning Characteristics of Building Materials. Mandatory for any panel used in RV interior wall and ceiling assemblies. Verify the test report includes both flame spread index and smoke-developed index values.
- FMVSS 302: Federal Motor Vehicle Safety Standard for flammability of interior materials. This is a non-negotiable legal requirement for any vehicle sold in the United States. If your supplier cannot produce a current FMVSS 302 test certificate, do not proceed with the order.
- ISO 9001: Certifies the manufacturer’s quality management system, not the product itself. It guarantees consistent process control, which is what ensures panel number 5,000 matches panel number 1. Raxpanel maintains ISO 9001 certification across our CFRT, GRP/FRP, foam core, and aluminum sandwich panel production lines for this exact reason.
Why Thickness Tolerance Determines Assembly Line Output
Inconsistent panel thickness is a silent production killer. If panels vary by more than a millimeter across a batch, adhesive bond lines become uneven, press cycle times increase, and mating components such as window flanges and trim extrusions no longer seat properly. The result is rework, scrap, and line slowdowns that erode any per-sheet cost savings you negotiated upfront.
We hold our CFRT Sandwich Panels and Foam Core Panels to a strict ±0.5mm thickness tolerance across the full sheet surface. This tolerance range is the benchmark for automated RV assembly lines where panels are robotically placed and vacuum-bonded. Standard RV wall thickness spans 1.25 to 2.5 inches (approximately 32mm to 64mm), so a ±0.5mm variance represents less than 1.6% deviation on the thinnest configuration. When evaluating suppliers, request tolerance data from three consecutive production batches, not a single controlled sample, to confirm the consistency holds under real manufacturing conditions.
Cost Per R-Value: Foam Core Panel Economics
Evaluating foam core panel economics requires normalizing material costs by the actual R-value delivered to the vehicle, rather than just comparing price per square foot of raw sheet stock.
Material Cost vs. Thermal Yield: Normalizing the R-Value
Procurement teams often fixate on the upfront cost of a 4×8 sheet without factoring in thermal yield. When you normalize the material cost by the R-value delivered, higher-performance foams easily outperform cheaper, thicker alternatives. You pay for thermal resistance, not simply volume.
Closed-cell polyiso rigid panels deliver roughly 50% more R-value per inch (R-5.6 to R-6.8) compared to standard EPS (R-3.6 to R-4.2). For an RV manufacturer constrained by standard wall thicknesses of 1.25 to 2.5 inches, using polyiso allows you to achieve target thermal resistance with a thinner core profile. This directly reduces overall material usage and sheds dead weight, dropping the panel weight to roughly 0.8 to 1.2 lbs/sq ft compared to traditional plywood assemblies weighing over 2.0 lbs/sq ft.
Procurement Logistics and Container-Load Pricing
Sourcing composite panels for specialized vehicle manufacturing is an exercise in freight optimization. Pricing structures rely heavily on production volume and logistics. We structure our manufacturing around full container loads to give OEMs the best unit economics, moving past the unpredictable pricing of partial shipments.
- MOQ Thresholds: Factory minimums typically align with production runs suited for a 20ft or 40ft container to ensure freight viability and consistent color matching across a single production lot.
- Container-Load Pricing: Full container loads (FCL) drop per-square-foot freight costs significantly compared to LCL (Less than Container Load) shipping, locking in a stable landed cost.
- Staggered Payment Terms: For qualified OEMs, we offer staggered payment structures (e.g., initial deposit, balance upon copy of Bill of Lading) to protect your cash flow during extended vehicle production cycles.
Lowering Per-Unit Costs via Custom Panel Sizes
The fastest way to destroy your margin on an RV composite panel is to buy standard sheet sizes and cut them down on your assembly line. Offcuts cost you money in wasted core material, wasted FRP skins, and added labor time. You are essentially paying to manufacture scrap.
By specifying custom panel dimensions directly to our production line, we cut the panels to your exact CAD specifications with a strict ±0.5mm thickness tolerance. This eliminates secondary trimming on your factory floor, accelerates production throughput, and lowers your per-unit raw material cost by ensuring zero production line waste.
| Insulation Material | R-Value per Inch | Weight (lbs/sq ft) | Thermal Conductivity | Cost-Performance Insight |
|---|---|---|---|---|
| Polyiso Rigid Foam Core | R-5.6 – R-6.8 | 0.8 – 1.0 | 0.022 W/mK | Highest R/lb ratio; 15–30% weight savings vs plywood at 3–5× insulation value |
| PU Closed-Cell Foam Core | R-5.6 – R-6.8 | 0.9 – 1.1 | 0.024 W/mK | Superior air seal & structural rigidity; ideal for four-season RV OEM builds |
| XPS Foam Core | R-4.5 – R-5.0 | 1.0 – 1.2 | 0.029 W/mK | Best moisture resistance for extreme cold/wet climates; stable long-term R-value |
| Azdel Onboard Composite | R-4.65 | ~0.9 (980gsm) | ~0.035 W/mK | 3.8× plywood R-value at comparable weight; no rot or mold risk |
| Fiberglass Batting | R-3.0 – R-5.0 | 0.3 – 0.5 | ~0.040 W/mK | Lowest material cost but loses R-value from settling, gaps, and moisture absorption |
| Plywood / Lauan (Baseline) | R-1.0 – R-1.2 | ~2.0 | 0.13 W/mK | Poorest R/lb ratio; heaviest option; delamination & warranty claim risk |
| Vacuum Insulated Panel | R-25+ | Varies | ~0.004 W/mK | Theoretical maximum; impractical for RV due to cost, fragility, and puncture failure |
Conclusion
If you’re building four-season RVs, spec continuous-core polyiso sandwich panels at 1.5 inches minimum. Whole-wall R-value hits roughly R-8.5 with zero thermal bridging — versus R-5.2 for an aluminum-framed wall using the same foam, because those studs bleed 15-26% of your rated insulation into nothing. You also drop 1.2 pounds per square foot compared to plywood construction at comparable material cost.
Before you commit to any supplier, request ASTM C518 thermal conductivity test data and a tolerance certificate confirming ±0.5mm thickness consistency across a full production run. Then have your assembly team run a sample panel through your existing fixtures. If the panel doesn’t seat cleanly in the first hour of testing, the R-value spec is irrelevant — production downtime will eat your margin faster than any material savings.
Frequently Asked Questions
What is the R rating for RV insulation?
RV insulation R-ratings typically range from R-4 to R-7 per inch depending on the specific material used in the wall assembly. For a standard 1.5-inch RV wall, total R-value ranges from R-6 with fiberglass batt to R-10.5 with closed-cell foam core panels. Four-season RVs target wall assemblies of R-11 to R-15 using 2-inch or thicker foam core sandwich panels, which deliver superior thermal performance while maintaining the lightweight profiles required for mobile applications.
What is the R-value of 2 inch foam board?
The R-value of a 2-inch foam board depends on the material: XPS delivers R-10, polyiso delivers R-11 to R-13.6, and EPS delivers R-7.7 to R-8.4. For RV applications, 2-inch polyiso foam core sandwich panels provide the best R-value per inch at the lightest weight, making them the preferred choice for manufacturers targeting four-season capability. When integrated into GRP/FRP or aluminum sandwich panel constructions, these foam cores also contribute structural rigidity and moisture resistance to the overall assembly.
What is the best insulation for an RV?
Closed-cell spray foam and polyiso rigid foam core panels are widely considered the best RV insulation options available in 2026. They deliver R-5.6 to R-6.8 per inch, resist moisture absorption, and add structural rigidity to the vehicle envelope. For production RV manufacturing, factory-bonded foam core sandwich panels outperform field-applied spray foam in consistency, quality control, and assembly speed, which is why leading OEMs increasingly specify pre-engineered composite panels for walls, roofs, and floors.
Does doubling foam board double the R-value?
Yes, stacking two foam board layers adds their individual R-values linearly, so two R-10 XPS boards yield R-20 total thermal resistance. However, in RV composite panel design, simply doubling thickness adds weight and may exceed cavity depth constraints in wall or roof assemblies. A more effective engineering approach is selecting a higher R-per-inch core material like polyiso instead of doubling a lower-performance EPS core, or upgrading to specialized aluminum or GRP sandwich panels that optimize thermal performance without unnecessary bulk.
How many inches of polyiso for R30?
To achieve R-30 with polyiso at R-5.6 to R-6.8 per inch, you need approximately 4.4 to 5.4 inches of total foam thickness. Two layers of 2.6-inch polyiso deliver R-30, which meets ASHRAE commercial roof requirements for stationary structures. For RV roof applications, R-20 to R-25 is far more common due to cavity depth constraints and weight limitations, and manufacturers typically achieve this using 2 to 3-inch polyiso foam core panels bonded between lightweight GRP or aluminum skins.