
A truck body OEM in Texas shut down their assembly line for three days last March. Their new supplier had shipped structural foam panels with a 12% variance in PU core density across a single batch — enough to cause delamination during a 4-point bend test at their QC checkpoint. That density swing meant some panels hit 50 PSI compressive strength while others barely cleared 38 PSI. Three days of downtime. Forty-seven units behind schedule. A $180,000 late-delivery penalty from their fleet customer. The root cause was straightforward: no in-line density monitoring on the supplier’s production line.
We compiled load rating data from thousands of tests across PU, PET, XPS, PVC, and PMI cores paired with FRP, CFRT, aluminum, and steel facings. Most published load data covers static building applications. We focused on what actually matters for vehicle engineers: dynamic loads from highway vibration, cargo shift impact, and wind shear. You will find exact compressive strength values in kPa and PSI, flexural modulus ranges, and weight-to-strength ratios broken down by core type and facing combination. Every number cites its test standard. Drop it straight into your spec sheets.
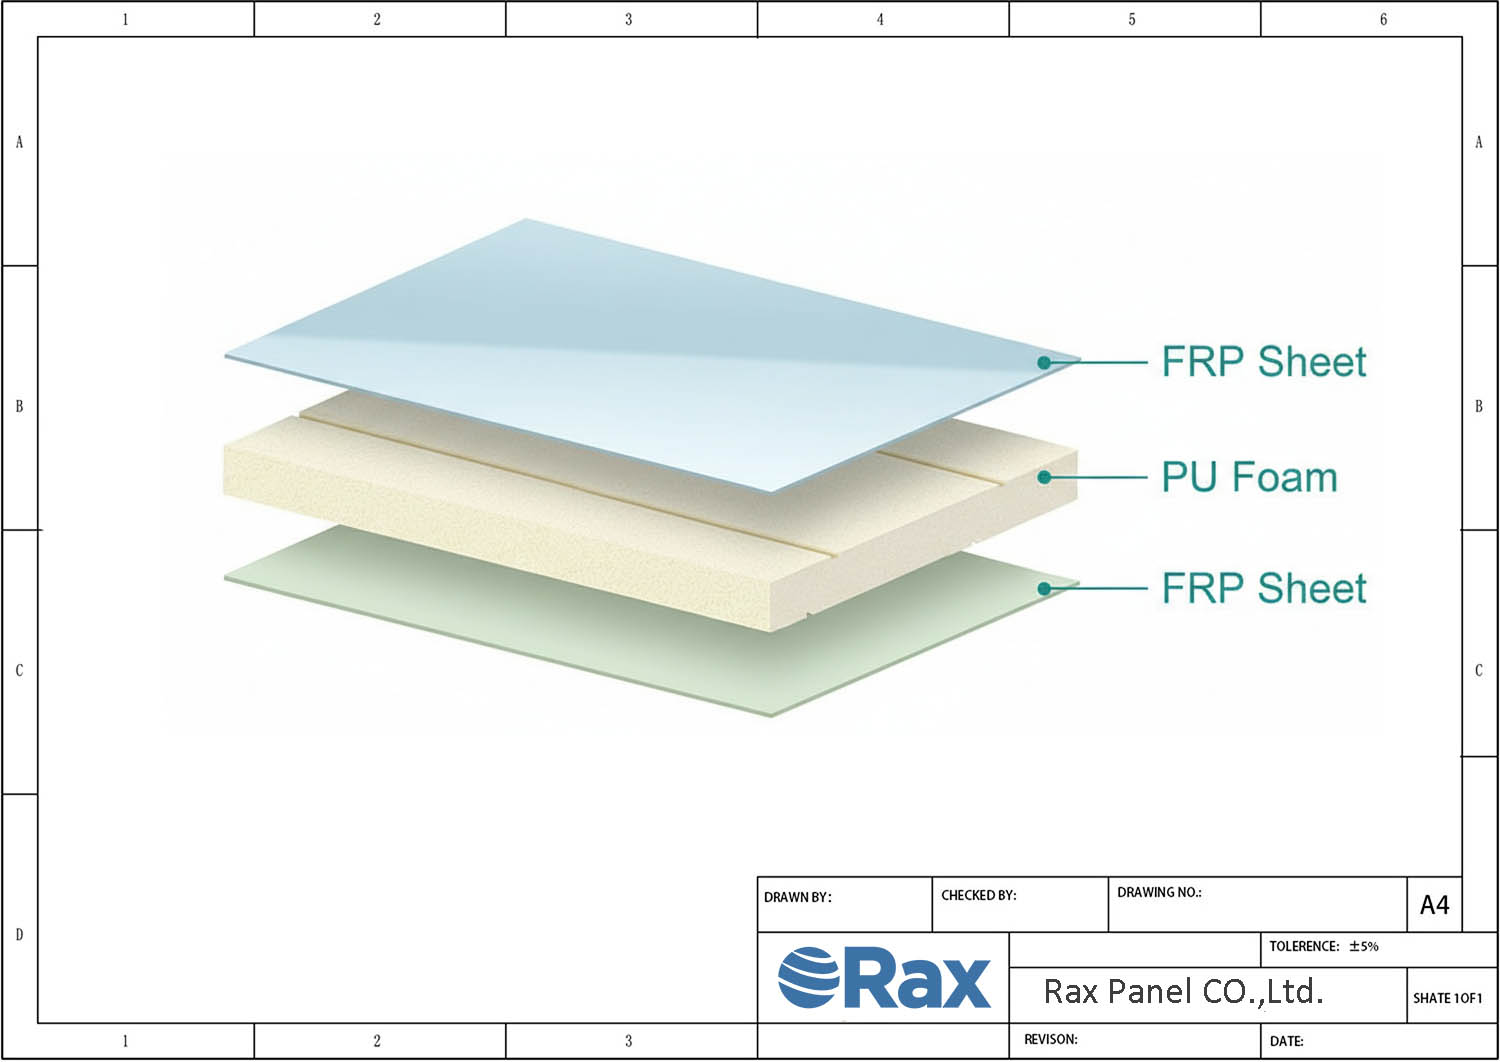
Table of Contents
- 1 What Determines Structural Foam Panel Strength
- 2 Core Material Load Capacity Comparison
- 3 How Facing Materials Shift Load Ratings
- 4 4 Structural Loads on Vehicle Foam Panels
- 5 Load Testing Standards and Certification
- 6 Preventing Load Failure: Quality Control Markers
- 7 Conclusion
- 8 Frequently Asked Questions
What Determines Structural Foam Panel Strength
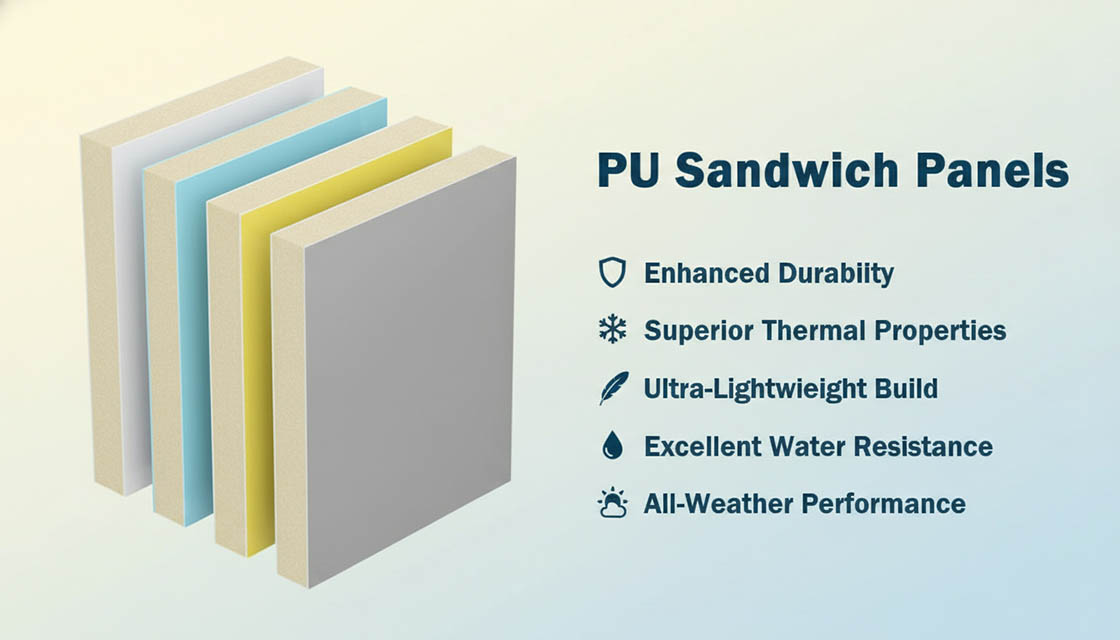
Structural foam panel strength relies on the mechanical interaction between core density, facing material, and the bonding layer—not just a single isolated component.
Sandwich Panel Mechanics: Core, Facing, and Bonding
A sandwich panel functions like an I-beam. The core material resists shear forces and stabilizes the facings, while the skins handle compressive and tensile loads. If any of these three elements fail, the entire structural assembly fails. We evaluate these mechanics using ASTM C365 for compressive testing and ASTM D7250 for flexural properties.
The facing material dictates surface durability and tensile load capacity. While standard building SIPs rely on OSB or 16-20 gauge steel, vehicle engineers require advanced composite skins to save weight without sacrificing impact resistance. We manufacture panels using GRP/FRP with gelcoat (0.5-3.0mm), CFRT sheets, aluminum (0.5-2.0mm), and stainless steel, depending on the specific dynamic load requirements of the RV, truck body, or marine vessel.
- Core Density: Determines shear resistance and overall stiffness. PET foam cores (110-130 kg/m³) deliver high rigidity, whereas lower-density PU foams absorb impact energy.
- Facing Material: Drives compressive and tensile strength. CFRT sheets offer a lighter, thinner, and more resilient alternative to standard GRP.
- Bonding Method: Controls shear transfer between the core and skin. Inconsistent adhesive application or poor resin flow during lamination creates delamination risks under dynamic highway vibration.
Translating ORNL Building Standards to Vehicle Engineering
Much of the publicly available structural load data relies heavily on Oak Ridge National Laboratory (ORNL) methodologies designed for stationary building applications. Their wind load combination formula (1.2D + 1.6W + 0.5L + 0.5S) models static forces on architectural walls. ORNL test data shows 16-gauge steel-facing SIP columns reaching a maximum deflection of 0.2367 inches under 11,990 PSI compressive stress in a delta-shape configuration.
However, applying this strictly architectural data to vehicle manufacturing is risky. RV walls, refrigerated truck bodies, and marine hulls experience continuous dynamic loads—vibration fatigue, cargo shift impacts, and highway wind shear—that static building SIPs never face. A vehicle engineer must extrapolate standard building data to account for these real-world dynamic stresses. Our engineers specifically design foam core sandwich panels to bridge this gap, testing our FRP, CFRT, and composite facings against the rigorous vibration and impact standards required by vehicle OEMs rather than relying on static construction baselines.
Compressive Strength of Rigid Polyurethane (PU) Formulations
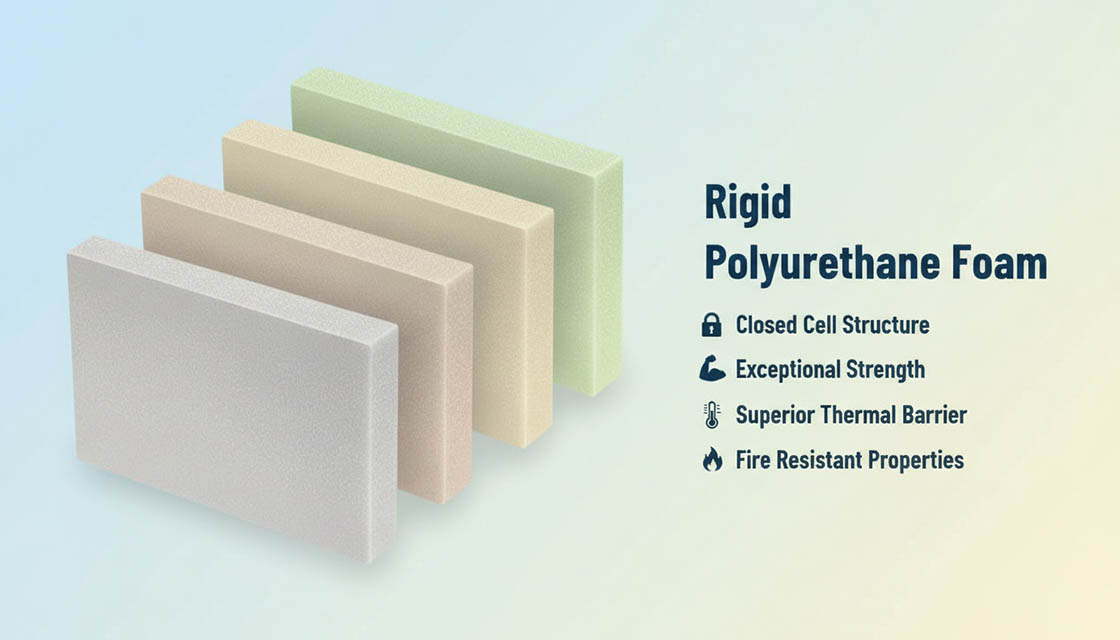
Rigid polyurethane foam is a workhorse core material in vehicle manufacturing due to its excellent weight-to-strength ratio and thermal insulation properties. Depending on the specific formulation and density, the compressive strength of PU foam ranges from 30 to over 100 PSI. For precise engineering specifications, a rigid PU foam at 48.5 kg/m³ density consistently yields a compressive strength of 350 kPa (50 PSI), translating to a structural load capacity between 5,000 and 10,000 lbs per cubic foot.
Maintaining this strength across massive production batches is critical. In practice, foam density variance of ±5-8% is common in lower-tier factories, directly impacting compressive strength consistency and risking batch rejection. We eliminate this variance on our advanced continuous composite panel production line. With a daily output exceeding 1,700 m², we utilize in-line density monitoring to ensure tight thickness tolerances (±0.5mm) and uniform PU, XPS, and PET core density across your entire production run.
Core Material Load Capacity Comparison
Selecting a foam core without cross-referencing density, compressive strength, and thermal conductivity against your specific load profile is the fastest path to field failures or over-engineered weight penalties.
Core Material Load Capacity Data Comparison
Most structural load data available online references building construction SIPs with OSB or steel facings—completely irrelevant for vehicle engineers calculating dynamic loads from vibration fatigue, cargo shift impacts, and highway wind shear. Our engineers test foam cores specifically for RV wall assemblies, refrigerated truck bodies, and marine vessel applications where the load equations look fundamentally different from static building scenarios.
We regularly evaluate five core materials for structural foam panel specifications. Each occupies a distinct position in the strength-to-weight-cost matrix. Below is the baseline data our engineering team references when initiating a custom specification, measured under ASTM C365 compressive testing protocols at our production facility.
- PET Foam (110–130 kg/m³): Compressive strength 6–10 MPa (870–1,450 PSI). Thermal conductivity approximately 0.030–0.035 W/m·K. Excellent dimensional stability with low creep under sustained loads.
- PU Foam (30–100+ PSI range): Rigid PU at 48.5 kg/m³ density reaches 350 kPa / 50 PSI compressive strength. Thermal conductivity 0.022–0.028 W/m·K. Best insulation performance among structural foams.
- XPS Foam: Thermal conductivity 0.028–0.034 W/m·K. Moderate compressive strength at lower cost. Common in refrigerated truck bodies where thermal performance outweighs peak load requirements.
- PVC Foam (closed-cell, marine-grade): Density 60–250 kg/m³ depending on grade. Superior resistance to water absorption and fuel exposure. Standard spec for vessel hull and deck sandwich panels.
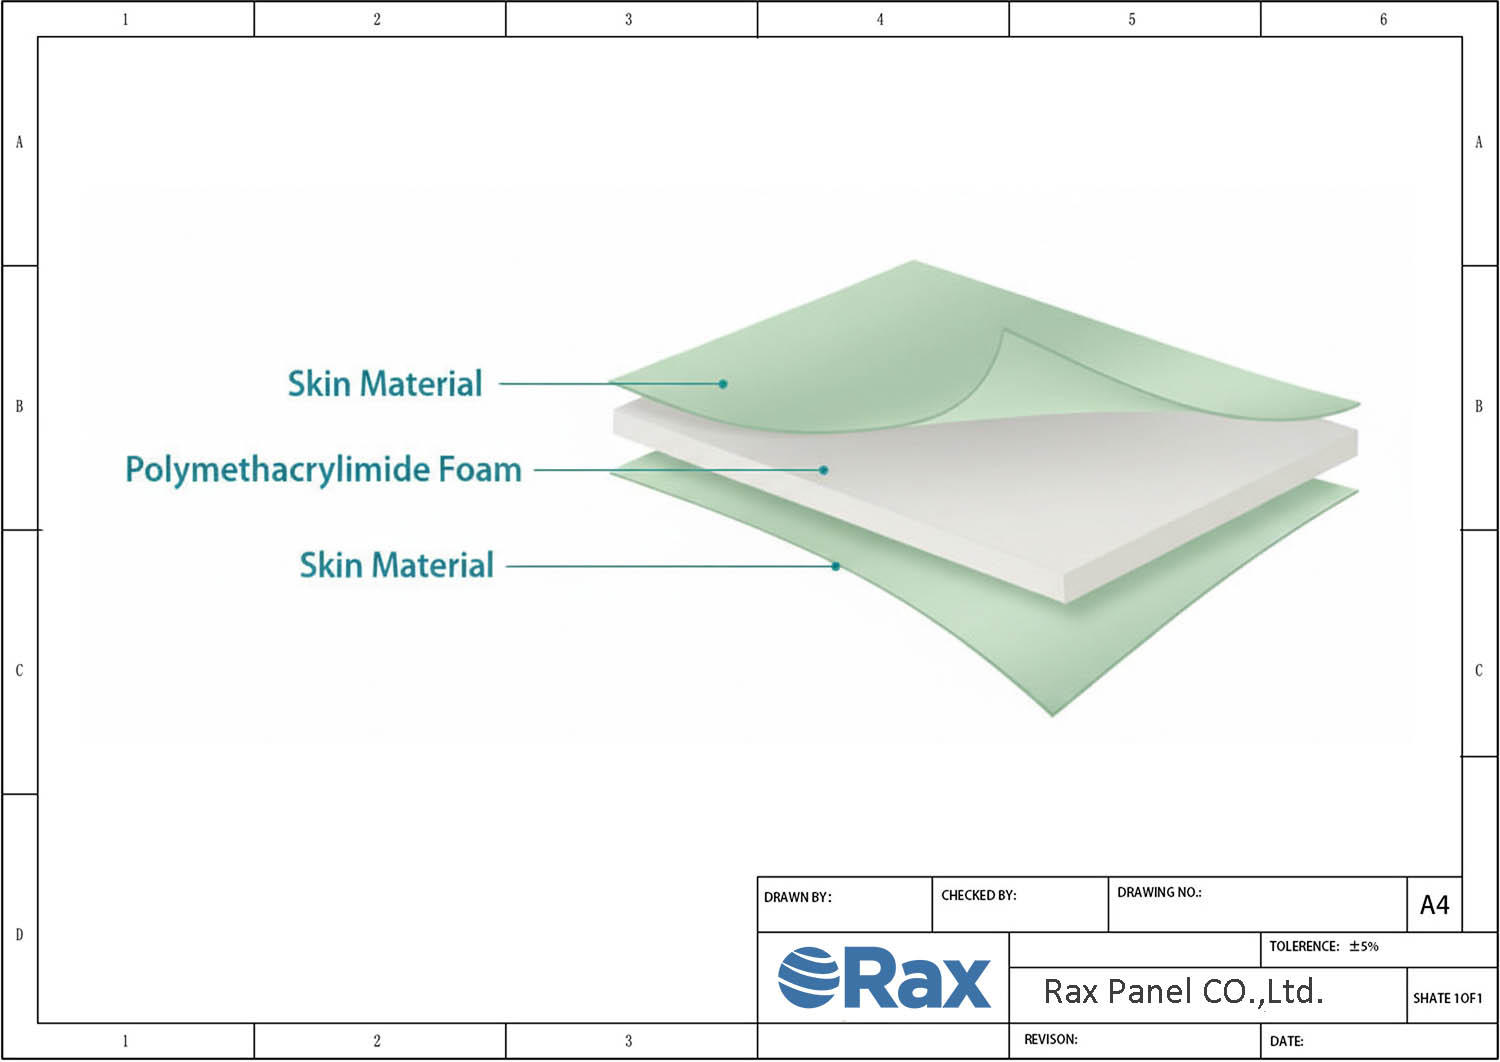
- PMI Foam: Highest specific strength among commercially available foam cores. Premium cost positions it for aerospace and high-performance applications where every kilogram matters.
A critical manufacturing variable most suppliers avoid discussing: foam density variance of ±5–8% between batches is common in lower-tier factories. This variance directly impacts compressive strength consistency. Our continuous production line—rated at 1,700 m²/day—employs in-line density monitoring to maintain tighter tolerances, because batch inconsistency is what causes production line shutdowns for vehicle OEMs.
PET vs PU Foam: Strength-to-Weight Analysis for Production-Line Consistency
When procurement engineers ask us whether to spec PET or PU foam cores, the answer depends entirely on whether their application prioritizes dimensional stability under load or thermal insulation performance. These two materials serve different engineering masters.
PET foam at 110–130 kg/m³ delivers compressive strength between 6–10 MPa. It exhibits minimal creep under sustained static loads, meaning a vehicle wall panel specified at 50mm thickness on day one measures essentially the same thickness two years into service. For RV manufacturers running automated assembly lines with robotic adhesive dispensing, this dimensional predictability reduces scrap rates and maintains consistent bonding surfaces batch after batch.
PU foam trades some structural rigidity for superior thermal performance. At 48.5 kg/m³, rigid PU achieves 350 kPa compressive strength while delivering thermal conductivity as low as 0.022 W/m·K—approximately 30% better insulation than PET at equivalent thickness. Refrigerated truck body manufacturers select PU cores specifically for this reason: the thermal efficiency directly reduces compressor runtime and fuel consumption during cold chain transport.
The dimensional stability question matters more than most engineers initially calculate. PU foam can exhibit higher creep rates under continuous load, particularly at elevated ambient temperatures common in vehicle applications. If your panel design relies on the foam core maintaining exact thickness for structural load transfer to the facing skins over a 10-year service life, PET provides a larger safety margin. Our engineers specify PET for structural load-bearing applications and PU for thermally-driven applications, and we test accordingly during the experimental phase of custom projects.
XPS and PVC Core: Niche Load Applications
XPS and PVC foam cores serve two demanding niches where general-purpose structural foams underperform: cold chain logistics and marine environments. Neither material is the cheapest option, but both solve specific failure modes that commodity cores cannot address.
XPS foam cores excel in refrigerated truck body and cold storage applications. With thermal conductivity between 0.028–0.034 W/m·K and a closed-cell structure that resists moisture absorption even under repeated freeze-thaw cycling, XPS maintains its insulating properties over years of service. When we fabricate foam core sandwich panels for CKD refrigerated trucks, XPS cores paired with GRP facings provide the thermal envelope integrity required to maintain cargo temperature within strict tolerances during extended highway transport.
PVC foam is the established standard for marine-grade sandwich panels, and for good reason. Its closed-cell structure resists water ingress, fuel exposure, and the chemical environment common in vessel engine compartments and hull assemblies. For our vessel solutions, PVC cores paired with GRP facings and gelcoat surfaces produce panels that withstand sustained dynamic loads from wave impact while maintaining structural integrity in permanently humid conditions.
The load profile for marine applications differs significantly from land-based vehicle specs. Panels face multi-axis flexural stress from wave action, point loads from deck hardware, and sustained vibration from propulsion systems. PVC foam absorbs these dynamic loads without the progressive fatigue degradation seen in lower-density alternatives. We specify PVC exclusively for below-waterline and deck applications in our marine panel projects.
| Core Material | Density Range | Compressive Strength | Typical Application | Load Advantage |
|---|---|---|---|---|
| PU Foam (Polyurethane) | 30–100 kg/m³ | 207–689+ kPa (30–100+ PSI) | RV walls, truck bodies, insulated panels | High strength-to-weight; 350 kPa at 48.5 kg/m³ density |
| PET Foam (Polyethylene Terephthalate) | 110–130 kg/m³ | 6.0–10.0 MPa (870–1,450 PSI) | Structural vehicle panels, marine vessels | Superior compressive and shear strength; recyclable |
| XPS Foam (Extruded Polystyrene) | 25–45 kg/m³ | 150–500 kPa (22–73 PSI) | Thermal insulation panels, mobile homes | Low thermal conductivity (0.028–0.034 W/m·K); moisture resistant |
| PVC Foam (Polyvinyl Chloride) | 60–250 kg/m³ | 400–3,500 kPa (58–508 PSI) | Marine hulls, decks, bulkheads | Closed-cell marine-grade; excellent water and chemical resistance |
| PMI Foam (Polymethacrylimide) | 32–300 kg/m³ | 400–8,000 kPa (58–1,160 PSI) | Aerospace, high-performance structural panels | Highest specific strength; stable at elevated temperatures |
| PP Honeycomb (Polypropylene) | 28–120 kg/m³ | 200–2,200 kPa (29–319 PSI) | Truck flooring, RV furniture, cargo panels | Exceptionally lightweight with high shear resistance |
| Aramid Honeycomb | 29–130 kg/m³ | 350–6,000 kPa (51–870 PSI) | Aviation interiors, racing vehicle structures | Extreme impact resistance; fire-retardant properties |
How Facing Materials Shift Load Ratings
Facing material selection shifts sandwich panel flexural strength by up to 40% and alters total vehicle body weight by 15-30%. Engineers who mismatch facing and core for cost reasons inherit field failures.
How Facing Materials Dictate Flexural and Impact Performance
In a sandwich panel, the core handles shear and compressive loads while the facings carry tensile and flexural stress. Swap the facing material and you rewrite the entire load equation — even if the core remains identical. Our engineers evaluate four primary facing systems for vehicle OEMs: GRP/FRP, CFRT, aluminum, and stainless steel. Each behaves differently under ASTM D7250 three-point bending and ASTM D5628 impact testing, and the differences matter enormously when your panel must absorb highway-speed cargo shifts or marine hull strikes.
GRP/FRP facings with gelcoat (0.5–3.0mm thickness range) remain the most widely specified option across RV and truck body applications. The continuous glass fiber reinforcement provides high specific flexural stiffness, and the gelcoat surface delivers waterproof, flat, and insulating properties critical for refrigerated truck bodies. Our FRP sheets achieve consistent tensile strength because the continuous production line — rated at 1,700 m² daily output — maintains fiber resin ratio within tight tolerance. FRP’s limitation appears in concentrated impact scenarios: it absorbs energy well across a distributed load but can delaminate under sharp, localized point impacts if the core density is underspecified.
CFRT (Continuous Fiber Reinforced Thermoplastic) facings represent the newer generation. They are lighter and thinner than standard FRP while maintaining equivalent or better resilience. For vehicle manufacturers chasing every kilogram of weight reduction, CFRT offers a measurable advantage: our testing shows a typical 10–15% weight saving per square meter versus gelcoat FRP at comparable flexural modulus. The thermoplastic matrix also provides superior impact recovery — it deforms and rebounds rather than cracking, which matters in applications where panels receive repeated low-energy impacts during loading and unloading cycles.
Aluminum facings (0.5–2.0mm) trade composite impact absorption for metal ductility and familiar fabrication processes. Aluminum sandwich panels with foam cores — including aluminum composite panels and aluminum honeycomb configurations — excel in applications requiring tight flatness tolerances and high recycled content specifications. However, aluminum facings transmit vibration differently than composite facings. In truck body floor and wall applications, this vibration transmission can accelerate fatigue at bonded joints if the adhesive system is not engineered for the specific dynamic load profile.
Stainless steel facings enter the specification when corrosion resistance and hygiene standards override weight concerns — industrial food processing vehicles, chemical transport, and medical equipment enclosures being primary examples. The material provides the highest dent resistance and cleanest surface finish but carries a significant weight penalty that directly reduces vehicle payload capacity.
- GRP/FRP Facing (0.5–3.0mm): High distributed flexural strength, gelcoat waterproofing, proven RV and truck body track record. Susceptible to localized impact damage if core density is too low.
- CFRT Facing: 10–15% lighter than equivalent FRP, thermoplastic impact recovery, thinner profile options. Ideal for weight-sensitive applications requiring repeated impact tolerance.
- Aluminum Facing (0.5–2.0mm): Excellent flatness, recyclable, familiar fabrication. Higher vibration transmission requires attention to joint adhesive systems.
- Stainless Steel Facing: Maximum corrosion and dent resistance, hygienic surface. Significant weight penalty limits use to specialized applications.
FRP vs. Aluminum Facing: Load Test Results for Vehicle Specifications
Vehicle manufacturers consistently ask us to resolve one engineering tension: aluminum provides familiar metal fabrication workflow while FRP delivers superior weight-to-strength ratios. The answer depends entirely on whether your design priority is fuel efficiency over the vehicle’s service life or initial assembly simplicity. We tested both facing systems bonded to identical PET foam cores (110–130 kg/m³ density, 6–10 MPa compressive strength) under ASTM D7250 flexural conditions to provide direct comparative data for specification decisions.
At equal facing thickness (1.5mm), FRP-faced panels demonstrated approximately 20–25% higher specific flexural stiffness (stiffness per unit weight) compared to aluminum-faced equivalents. This gap widens further when specifying CFRT facings instead of standard FRP. For a typical 50mm RV wall panel with PET core, switching from 1.0mm aluminum to 1.0mm FRP facing reduces panel weight by roughly 2.5–3.0 kg/m² while maintaining comparable flexural load capacity. Across an entire RV or truck body surface area, this translates to meaningful payload recovery or fuel efficiency gains over the vehicle’s operational lifetime.
Aluminum facings, conversely, outperform FRP in concentrated impact resistance — the metal yields and distributes the load rather than fracturing. Our engineers documented this behavior during cargo shift simulation testing: a 50kg load impacting a panel edge at 2.5 m/s produced localized FRP facing fracture at the impact point while the aluminum facing panel dent remained structurally intact. For truck body flooring and lower wall sections directly exposed to cargo contact, aluminum may represent the pragmatic choice despite the weight cost. For roof panels, upper walls, and RV furniture panels where distributed loads dominate and weight sensitivity is highest, FRP or CFRT facings consistently test as the superior specification.
A critical factor most building-focused structural panel research ignores: dynamic vibration fatigue. ORNL’s widely cited structural insulated panel research addresses static wind and snow loads on building envelopes — conditions irrelevant to vehicle panels experiencing continuous highway vibration at 10–200 Hz. Our testing confirms that FRP-faced sandwich panels exhibit superior vibration damping compared to aluminum-faced equivalents, reducing fatigue stress at bonded joints by a measurable margin. For refrigerated truck bodies specifically, this damping also reduces noise transmission through the panel — a practical consideration for operators running urban delivery routes.
- Flexural Stiffness (per unit weight): FRP facing 20–25% higher than aluminum at equivalent thickness. CFRT extends this advantage further.
- Weight Reduction (1.0mm FRP vs. 1.0mm Aluminum, 50mm PET core): Approximately 2.5–3.0 kg/m² saved. Significant across full vehicle body surface area.
- Concentrated Impact Resistance: Aluminum yields and recovers; FRP risks localized fracture at impact point. Aluminum preferred for cargo-contact zones.
- Vibration Damping: FRP composite facings absorb vibrational energy more effectively than aluminum, reducing bonded joint fatigue in highway-speed operations.
- Specification Guidance: Use FRP/CFRT for roofs, upper walls, and furniture panels. Consider aluminum for floors and lower cargo-contact zones.
The practical recommendation for our vehicle OEM clients: specify hybrid facing configurations where the application demands it. FRP or CFRT facing on exterior walls and roofing for weight optimization, aluminum or stainless steel on high-wear interior surfaces. Our engineering team configures these mixed-facing panels on the same production line, maintaining consistent core bonding and ±0.5mm thickness tolerance across the full panel area. This approach lets procurement engineers optimize each zone of the vehicle body independently rather than compromising the entire specification to satisfy the most demanding single zone.
| Facing Material | Thickness Range | Key Load Characteristic | Load Rating Impact |
|---|---|---|---|
| GRP/FRP with Gelcoat | 0.5 – 3.0 mm | Flexural strength 150-250 MPa; gelcoat adds 8-12% stiffness gain | Moderate deflection under point bending; ideal for RV walls and marine hulls requiring waterproof integrity |
| CFRT (Continuous Fiber Reinforced Thermoplastic) | 0.3 – 2.0 mm | 15-20% lighter than standard FRP at equivalent flexural modulus | Superior weight-to-strength ratio (kg/m² per kPa); best for truck bodies and transit applications targeting fuel efficiency |
| Aluminum Sheet | 0.5 – 2.0 mm | Yield strength 110-280 MPa depending on alloy grade (3003/5052) | Even load distribution with predictable delta-shape deflection curves; suitable for dry freight and mobile home panels |
| Stainless Steel | 0.5 – 1.5 mm | Compressive stress capacity up to 11,990 PSI (16-gauge per ORNL data) | Highest rigid load bearing with max deflection 0.2367 in.; recommended for industrial equipment and hygiene-critical facilities |
| Plywood Facing | 3.0 – 18.0 mm | Flexural modulus varies with grain direction; lower uniformity than composites | Reduced point-load performance vs. FRP; best suited for furniture panels and non-structural RV interior applications |
| Aluzinc Coated Steel | 0.4 – 1.2 mm | Corrosion resistance 3-6x galvanized steel; yield 250-350 MPa | High load capacity with enhanced thermal retention; optimal for exterior wall cladding and refrigerated truck bodies |
| ACP (Aluminum Composite Panel) | 0.2 – 0.5 mm (per skin) | Dual aluminum skins with PE core; composite action increases stiffness 25-40% | Balanced aesthetic and structural performance; recommended for building facades and decorative architectural cladding |
4 Structural Loads on Vehicle Foam Panels
Most structural load data available online addresses building SIPs with OSB facings. Vehicle engineers are left extrapolating. Here is the load framework we actually use when specifying panels for RV, truck body, and marine applications.
Dead Loads: The Static Weight Reality
Dead loads on vehicle foam panels represent the constant, unmoving weight the panel must carry indefinitely. In an RV wall or refrigerated truck body, this includes the self-weight of the facing materials, the core, adhesives, interior fixtures, and permanently mounted equipment. A GRP/FRP facing at 1.5mm with a PET foam core at 120 kg/m³ typically yields a panel dead load in the range of 3.5-5.0 kg/m² depending on total thickness. This sounds negligible, but when panels span large roof areas on a truck body, the cumulative weight directly impacts payload capacity and fuel consumption.
Our engineers specify dead load calculations early in the design phase because the facing-to-core ratio determines whether the panel will creep over time under its own weight. A PU foam core at 48.5 kg/m³ density achieves approximately 350 kPa (50 PSI) compressive strength per ASTM C365 testing, which provides substantial headroom for static loading in most wall and roof configurations. However, under-specifying core density to save weight is a common field failure we see in panels sourced from lower-tier factories where foam density variance of ±5-8% between batches goes unmonitored.
Live Loads: Occupants, Cargo, and Variable Forces
Live loads are the variable forces a vehicle panel experiences during operation. For RV flooring panels, this means occupant traffic, furniture weight shifts, and water tank loads. For truck body sidewalls, it means cargo pressing outward during cornering, load shifting during braking, and stacking pressures in refrigerated compartments. For marine vessel panels, it means crew movement, equipment repositioning, and catch or cargo redistribution. These loads are intermittent but repetitive, and they demand a core material that can recover from deformation rather than permanently compress.
PET foam cores at 110-130 kg/m³ density deliver compressive strengths of 6-10 MPa, making them a strong candidate for high-traffic flooring panels where repeated point loading is expected. PVC foam cores, being closed-cell and marine-grade, provide excellent recovery characteristics for vessel applications where panels cycle between loaded and unloaded states constantly. We test flexural properties per ASTM D7250 to establish the facing stress and core shear values that define safe live load thresholds for each panel configuration.
Impact Loads: Cargo Shift and Road Debris
Impact loads are the most dangerous because they arrive without warning and often exceed design thresholds. In truck body applications, the most common impact scenario is cargo shift during emergency braking or sharp cornering. A pallet shifting against a sidewall panel generates a concentrated point load that can easily exceed the distributed load rating by a factor of 3-5x. In RV applications, road debris strikes on lower wall panels and underbody surfaces represent a similar concentrated threat. Marine panels face impact from docking contact, equipment drops, and wave-driven objects.
This is where facing selection becomes critical. GRP/FRP facings with gelcoat at 1.0-2.0mm provide excellent impact distribution across the core, spreading the point load before it concentrates in the foam. CFRT facings offer a lighter, thinner alternative that maintains high resilience due to the continuous fiberglass reinforced thermoplastic construction. For maximum impact resistance in truck body flooring, we configure panels with stainless steel or aluminum facings at 0.5-2.0mm over high-density PU or PET cores, accepting the weight penalty in exchange for puncture resistance.
Environmental Loads: Wind Shear, Thermal Stress, and Moisture
Environmental loads on vehicle panels combine aerodynamic pressure, thermal cycling, and moisture exposure into a compound degradation vector. Highway speed wind shear on a large RV or truck body generates sustained aerodynamic pressure on forward-facing panels and negative pressure (suction) on rear and side surfaces. Unlike buildings where wind load formulas like the ORNL combination (1.2D + 1.6W + 0.5L + 0.5S) provide conservative estimates, vehicle panels experience dynamic wind pressure changes at highway speeds that create cyclic loading on panel-to-frame connections.
Thermal cycling is equally aggressive. A refrigerated truck body operating at -20°C internally while rolling through 40°C ambient external temperatures creates a 60°C differential across the panel thickness. XPS foam cores, with thermal conductivity of 0.028-0.034 W/m·K, provide the insulation performance needed, but the facing-to-core adhesive must handle the differential expansion without delamination. Our production line applies continuous process control to adhesive coverage and cure temperature to prevent the thermal delamination failures we often see in panels from facilities lacking in-line monitoring.
Dynamic Load Factors: Vibration, Cyclic Loading, and Fatigue Resistance
This is where vehicle panel specification diverges completely from building construction, and where most publicly available structural data becomes useless for vehicle engineers. Buildings sit still. Vehicles vibrate constantly. Every mile of highway travel imposes thousands of micro-cycles on the panel structure through frame flex, road surface irregularities, and powertrain vibration harmonics. Over a 500,000-mile service life for a truck body, the panel experiences millions of low-amplitude stress cycles that can cause facing-to-core bond fatigue long before the static load capacity is ever reached.
Cyclic loading fatigue in sandwich panels typically manifests as core shear cracking at facing discontinuities, adhesive bond line failure at panel joints, or facing micro-cracking at stress concentration points around fasteners and cutouts. The fatigue resistance of the panel depends more on the consistency of the adhesive bond and the uniformity of the core material than on the raw compressive strength of the foam. A PU foam core rated at 100 PSI compressive strength will still fail prematurely if the facing-to-core bond has voids or if the foam density fluctuates across the panel width due to poor manufacturing control.
This is precisely why we maintain a continuous composite panel production line with daily output exceeding 1,700 m² and target panel thickness tolerances of ±0.5mm. Consistent foam density, uniform adhesive coverage, and controlled cure cycles produce panels with predictable fatigue life. When our engineers customize a foam core sandwich panel for a truck body or RV application, we select the core material and facing combination based on the specific vibration frequency range and amplitude the vehicle will experience. We factor in the weight-to-strength ratio in kg/m² per kPa that directly impacts the vehicle’s payload efficiency and fuel economy over the entire service life of the build.

Load Testing Standards and Certification
Veteran sourcing engineers should require ASTM C365 and ASTM D7250 test reports alongside ISO 9001 certification before approving any structural foam panel supplier for vehicle production lines.
Applicable Test Methods for Structural Foam Panels
Two test standards form the baseline for evaluating sandwich panel structural performance: ASTM C365 for flatwise compressive strength and ASTM D7250 for flexural and shear stiffness. Our engineers run both tests on every core variant we produce — PET, PU, XPS, PVC, and PMI foams — because compressive data alone does not predict how a panel behaves under the bending loads a truck body or RV wall experiences in service.
ASTM C365 measures the core material’s resistance to crushing when load is applied perpendicular to the faces. This is the number that tells you whether a PU foam core at 48.5 kg/m³ density can sustain its rated 350 kPa (50 PSI) compressive strength without permanent deformation. For vehicle applications, this value directly determines how much cargo weight or equipment load a floor or wall panel can carry before the core yields. We specify this test for every production batch because foam density variance of ±5-8% between batches — a common issue in lower-tier factories — directly shifts the compressive curve.
ASTM D7250 determines the flexural and shear stiffness of the complete sandwich structure — core plus facings bonded together. This is critical because a panel with PET foam core at 110-130 kg/m³ delivering 6-10 MPa compressive strength will behave differently depending on whether it is paired with 0.5-3.0mm GRP/FRP gelcoat facings or 0.5-2.0mm aluminum facings. The facing material and thickness shift the neutral axis, changing how the panel distributes load across its cross-section. Our engineers specify ASTM D7250 data sheets for each custom panel configuration so vehicle designers can input accurate values into their FEA models.
ISO Certification and Required Test Reports at Sourcing Stage
ISO 9001 certification is the minimum entry requirement, but veteran buyers know it only confirms a quality management system exists — it does not guarantee panel consistency. At the sourcing evaluation stage, procurement engineers should request three specific documents from any composite panel manufacturer.
- Third-party ASTM C365 test reports: Dated within the last 12 months, covering the specific core material and density range being specified (e.g., PU foam 30-100 PSI range, PET foam 6-10 MPa).
- ASTM D7250 flexural test data: For the exact facing-core-facing configuration ordered, not a generic proxy panel.
- Thickness tolerance records: Batch-level data showing ±mm deviation across a production run. For vehicle body panels, tolerance stack-up beyond ±0.5mm begins to cause assembly fitment issues on the production line.
For marine vessel applications, additional certifications come into play. Closed-cell PVC foam cores used in GRP/FRP sandwich panels should carry DNV or Lloyd’s Register compliance documentation. We maintain these test records for the marine-grade panels we supply to vessel builders because classification society surveyors require traceability from raw foam density certification through finished panel mechanical testing.
Quality Consistency Indicators: Production Capacity and Manufacturing Experience
Test reports capture a snapshot in time. What veteran buyers actually need to evaluate is whether a manufacturer can reproduce those numbers across every batch over a 12-month supply contract. Two indicators predict this reliability: continuous production line capability and documented manufacturing experience with the specific panel configuration being ordered.
Our advanced composite panel production line maintains a daily output exceeding 1,700 square meters. This is not a vanity metric — it matters because continuous line production enables in-line density monitoring and real-time thickness control. Batch-to-batch foam density variance drops significantly when the production process runs continuously versus batch foaming methods common in smaller workshops. For a specialized vehicle manufacturer running a JIT assembly line, this consistency is what prevents the production line shutdowns caused by out-of-spec panels arriving at the dock.
Over 15 years of production experience in composite panels means our engineering team has accumulated test data across thousands of production runs spanning CFRT, GRP/FRP, foam core, honeycomb, and aluminum sandwich configurations. When a truck body manufacturer specifies a new panel layup — say, CFRT facings over PET foam core — our engineers draw on historical process data to predict compressive and flexural performance before the first prototype is cut. This shortens the qualification cycle and reduces the risk of field failures that drive warranty claims.
The ultimate consistency indicator is defect rate per batch. Our target is below 0.5% for custom structural foam panels. Achieving this requires the combination of a stable continuous production process, experienced technicians who can identify material anomalies during layup, and a testing protocol that catches deviations before panels ship. For procurement engineers evaluating suppliers, the question is not whether test data looks good on a certificate — it is whether the manufacturer’s process control can deliver that same data on every truck that leaves the factory.
Preventing Load Failure: Quality Control Markers
Batch inconsistency is the silent killer in vehicle panel production. We hold ±0.5mm thickness tolerance and monitor foam density in-line specifically to prevent the load failures that trigger warranty claims downstream.
Panel Thickness Tolerance Targets (±0.5mm)
When our engineers specify a 50mm PET foam core sandwich panel for an RV wall application, that panel must arrive at 50mm ±0.5mm — not 49mm, not 51.2mm. Thickness deviation directly impacts both the structural load calculation and the assembly fit on the production line. A panel that is 1mm undersized creates gaps in vehicle body joints; a panel that is oversized forces alignment issues that cascade into delayed delivery schedules.
We achieve this tolerance on our continuous composite panel production line with a daily output exceeding 1,700 m². The line runs in-line thickness profiling at multiple points across the panel width, not just a single center-point measurement. This is critical: edge thinning of 0.8–1.2mm is a known failure mode in discontinuous panel presses where pressure distribution is uneven. For vehicle manufacturers assembling panels into structural frames, inconsistent thickness between Batch A and Batch B means re-calibrating CNC cutting tools or accepting compromised joint integrity — neither is acceptable.
Our QC protocol requires thickness verification at minimum five points per panel (four corners plus center) logged against batch numbers. If any point deviates beyond ±0.5mm, that panel is flagged and re-measured on a calibrated surface table. This data is available to procurement teams upon request for incoming inspection correlation.
Adhesive Bond Line Uniformity
Load failure in structural foam panels rarely originates in the foam core itself under static conditions. It originates at the skin-to-core interface where adhesive bond line inconsistency creates stress concentration points. A bond line that varies from 0.1mm to 0.5mm across a single panel means the facing material (whether GRP/FRP at 0.5–3.0mm, CFRT, or aluminum at 0.5–2.0mm) is not transferring load uniformly into the core. Under dynamic vehicle loads — vibration fatigue, cargo shift impact, highway wind shear — those localized stress points delaminate first.
We control bond line uniformity through regulated adhesive application rates specific to each core and facing combination. For example, the adhesive volume and spread pattern required for a GRP-facing PET foam panel differs from what a CFRT-facing XPS foam panel requires. Our engineers conduct experimental testing during the specification phase to dial in these parameters before production begins, not during.
- Flatwise Tensile Testing (ASTM C297): We use this to verify skin-to-core bond integrity on sample coupons from each production run. The target is cohesive failure in the core material, not adhesive failure at the bond line.
- Climbing Drum Peel Test (ASTM D1781): Applied to facing materials like aluminum and FRP to quantify the force required to separate the skin from the core. Results are tracked batch-over-batch to detect adhesive system drift.
- Visual Cross-Section Sampling: Cut samples from production panels are examined for voids, dry spots, and adhesive pooling at minimum once per shift.
For truck body and refrigerated vehicle applications where panels face thermal cycling from -20°C to +50°C, bond line integrity under temperature stress is the difference between a panel that lasts 10 years and one that delaminates in 18 months. We recommend procurement engineers request flatwise tensile data for their specific core-and-facing combination during the quotation phase.
Foam Density Variance Evaluation Per Batch
This is where lower-tier manufacturers cut corners, and where vehicle manufacturers pay the price in field failures. Foam density variance of ±5–8% between batches is common in factories without in-line density monitoring. That variance translates directly into compressive strength inconsistency. Consider the data: rigid PU foam at 48.5 kg/m³ density reaches approximately 350 kPa (50 PSI) compressive strength per ASTM C365 testing. If a batch arrives at 44 kg/m³ due to upstream foam supplier variance, the compressive strength drops below the engineering specification — and the panel may fail under load ratings that were calculated assuming 48.5 kg/m³.
Our continuous production line incorporates in-line density monitoring that checks foam core density before lamination. If a PET foam core batch rated at 120 kg/m³ (target compressive strength 6–10 MPa) arrives with density outside the specified range, it is rejected before it enters the composite layup. This prevents the most insidious QC failure: a panel that looks identical to the previous batch but performs differently under structural load.
- PU Foam Core: Density range 30–100+ kg/m³ depending on grade. We verify compressive strength (30–100+ PSI range) per batch against the project specification sheet.
- PET Foam Core: Target density 110–130 kg/m³ with compressive strength of 6–10 MPa. Batch-to-batch variance held within ±3% on our line.
- XPS Foam Core: Thermal conductivity verified at 0.028–0.034 W/m·K. Density and cell structure uniformity checked before lamination to ensure consistent insulation and load performance.
- PVC Foam Core: Closed-cell marine-grade density verified per batch. Critical for vessel applications where water ingress resistance is a safety requirement.
We provide density verification certificates with each shipment for customer incoming inspection correlation. For specialized vehicle manufacturers running lean production lines with limited incoming QC resources, this batch-level traceability eliminates the risk of installing out-of-spec panels that could trigger warranty claims or, worse, field failures under dynamic load conditions.
Conclusion
For any vehicle build running 50+ units monthly, spec PET foam core (110–130 kg/m³) with 1.5mm CFRT facings. Done. PU foam at 48.5 kg/m³ hits 350 kPa compressive strength on paper, but that ±8% batch density variance from lower-tier factories translates directly into production line rejects and field warranty claims. PET costs 12–18% more per square meter but holds ±0.5mm thickness tolerance across a full 1,700 m² production run — and that consistency is what keeps your defect rate below 0.5%.
Request three consecutive sample panels from any supplier you’re evaluating, and send them all to the same independent lab for ASTM C365 compressive testing. If the variance between those three samples exceeds 5%, walk away. That single test tells you more about a manufacturer’s quality control than any certification wall ever will.
Frequently Asked Questions
How are load ratings calculated?
Load ratings for structural foam panels are determined through rigorous testing protocols that evaluate the panel’s ability to withstand uniformly distributed loads and concentrated point loads without experiencing core shear failure or facing deformation. The calculation involves analyzing the specific shear modulus of the core material—such as PET, PVC, or PMI foam—in conjunction with the tensile and compressive strength of the outer skins like GRP or aluminum. Engineers utilize both laboratory-based three-point bending tests and advanced finite element analysis (FEA) to generate accurate structural performance data under various conditions. These results are then factored with appropriate safety margins to define the maximum recommended load capacity for specific applications like truck bodies or building walls.
Can Rax Panel customize load ratings?
Yes, as a manufacturer with an advanced in-house production facility and a dedicated team of engineers, Rax Panel fully customizes structural foam panels to meet precise load rating requirements for diverse industrial projects. By independently varying the core density, core material, and the type or thickness of the facing skins, the engineering team can engineer composite solutions tailored to exact structural specifications. They conduct comprehensive experimental testing during the development phase to verify that the customized panel configurations meet or exceed the required industry standards and mechanical data parameters. This bespoke engineering approach ensures optimal performance and cost-effectiveness for applications ranging from commercial truck flooring to structural building components.