
Procurement teams specifying wall systems for 2026 commercial projects face a hard truth: ASHRAE 90.1 and IECC energy code requirements are tightening fast enough to make traditional stick framing a compliance risk. Structural insulated panels solve this by combining continuous insulation with factory-sealed joints, eliminating the thermal bridging and air leakage that drain stud walls of their rated performance. The gap is not small. U.S. DOE testing confirms SIP buildings are 15 times more airtight than stick-framed structures. Oak Ridge National Laboratory measured a 47% whole-wall R-value advantage for a 3.5-inch SIP wall over conventional 2×4 framing with fiberglass batts: 14.09 versus 9.58. Buildings constructed with these panels reduce heating and cooling energy demands by at least 60% compared to conventional construction.
This guide compares composite panel thermal performance against stick framing using third-party test data, breaks down how core material selection, whether EPS, PU, PET, or XPS, shifts conductivity from 0.022 to 0.038 W/mK, and calculates real energy payback timelines for commercial and industrial builds. The objective: defensible numbers for code compliance reviews, specification meetings, and 10-year operating cost projections, not manufacturer claims.
What Are Structural Insulated Panels
Structural insulated panels are factory-engineered composite assemblies that bond a rigid insulating core between two structural facings, forming a single load-bearing unit. The facing material is the variable most procurement teams underestimate: it dictates long-term durability in moisture-heavy and corrosive environments.
Definition: SIPs vs. Composite Sandwich Panels
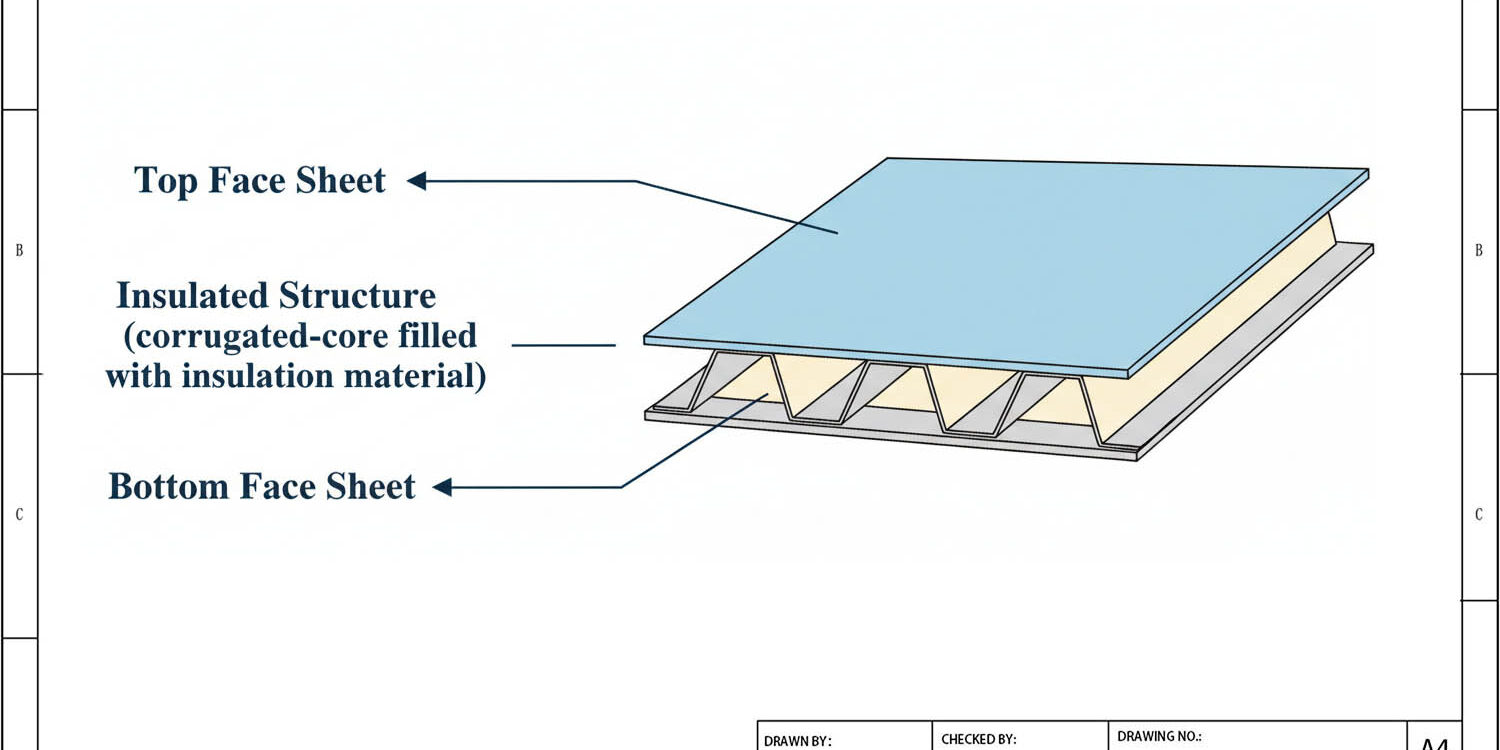
A structural insulated panel (SIP) is a prefabricated building component consisting of a rigid foam insulation core sandwiched between two structural facings. The assembly acts as a unified structural element, carrying axial loads, resisting shear forces, and providing thermal insulation simultaneously.
In the broader market, the term “SIP” is most commonly associated with OSB-faced panels with EPS cores used in residential construction. However, the underlying engineering principle, a lightweight core separating two high-strength skins to maximize stiffness-to-weight ratio, is identical to what the composites industry calls a sandwich panel.
Composite sandwich panels expand the SIP concept beyond wood facings. By substituting OSB with non-wood structural skins such as FRP, CFRT, aluminum, or stainless steel, the resulting panel maintains the continuous insulation and airtightness advantages of a SIP while gaining superior moisture resistance, corrosion protection, and dimensional stability. This distinction is critical for commercial construction procurement officers specifying panels for cold rooms, agricultural buildings, marine vessels, or any environment where OSB would delaminate within years.
Core Materials and Facing Options
The thermal and structural performance of any sandwich panel is determined primarily by the core material selection. EPS (Expanded Polystyrene) remains the most widely used core in the conventional SIP market due to its low cost. However, industrial and commercial applications often demand cores with lower thermal conductivity, higher fire resistance, or greater compressive strength than EPS can provide. Rax Panel manufactures composite panels using the following core types:
- XPS (Extruded Polystyrene): Thermal conductivity 0.029–0.035 W/mK. Higher compressive strength and lower moisture absorption than EPS, suitable for below-grade and cold-room applications.
- PU (Polyurethane): Thermal conductivity 0.022–0.028 W/mK. The lowest-conductivity foam option available, critical for refrigerated truck bodies and cold storage operating at −20°C.
- PET (Polyethylene Terephthalate): Thermal conductivity 0.030–0.035 W/mK. Recyclable thermoplastic core with good fire performance, increasingly specified for green building compliance.
- PVC Foam: Closed-cell structure offering a combination of low weight, high shear strength, and resistance to water ingress. Common in marine and transportation applications.
- PMI, EPP, and MPP Foams: High-performance cores for applications requiring extreme weight reduction alongside structural rigidity, including aerospace and specialized vehicle manufacturing.
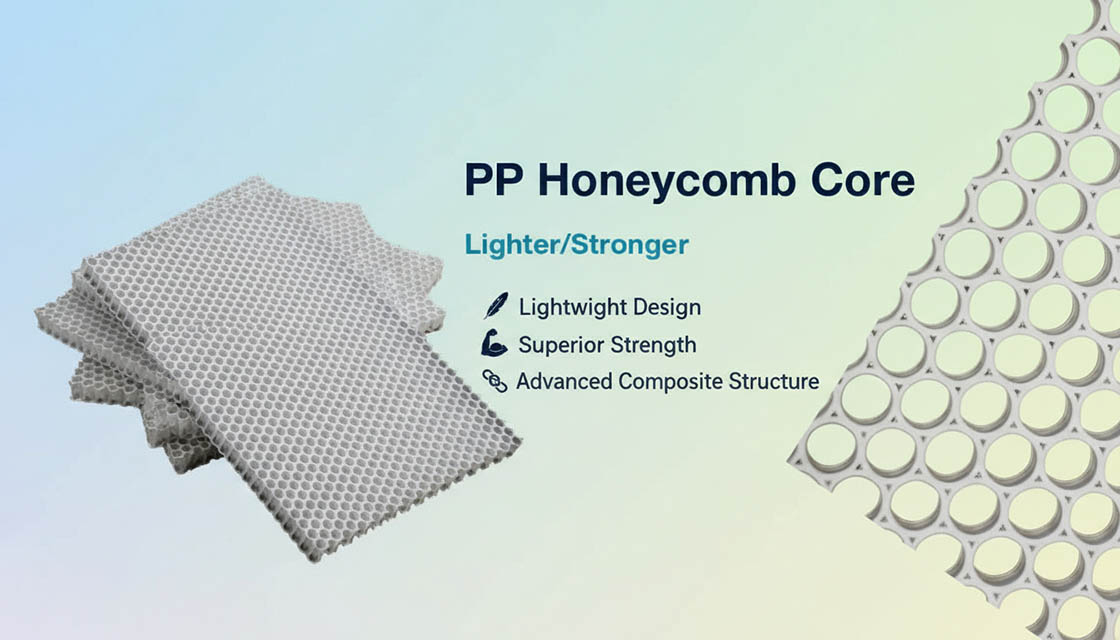
- PP, Aramid, and PC Honeycomb: Honeycomb cores that deliver maximum stiffness at minimum weight, with thermal conductivity dependent on cell geometry and facing material.
The facing material transfers loads into the core and defines the panel’s resistance to environmental degradation. Rax Panel offers the following facing options: GRP/FRP (fiberglass reinforced plastic, with or without gelcoat), CFRT (continuous fiberglass reinforced thermoplastic), aluminum sheet, stainless steel, ACP (aluminum composite panel), PVC, plywood, and Aluzinc-coated steel. Each facing pairs with different cores to meet specific structural, thermal, fire-rating, and aesthetic requirements.
Advantages of Non-Wood Facings Over Traditional SIPs
Traditional OSB-faced SIPs perform well in dry, temperate residential construction. The problem emerges when those same panels are specified for environments with sustained moisture exposure, chemical vapor, or hygiene requirements. OSB absorbs water at panel joints, leading to swelling, delamination, mold growth, and structural degradation. Such failures are not covered under most warranties once moisture intrusion is attributed to site conditions rather than manufacturing defects.
Non-wood composite facings eliminate this vulnerability entirely. FRP facings with gelcoat are waterproof, chemically inert, and provide a smooth, non-porous surface that meets hygiene standards for food processing and pharmaceutical facilities.
CFRT facings are lighter, thinner, and more resilient than traditional FRP while maintaining equivalent strength, a weight saving that compounds across large commercial installations, reducing both structural load and transportation costs. Aluminum and stainless steel facings add corrosion resistance and fire performance that OSB cannot achieve without additional treatments that increase cost and complicate recycling.
For industrial facility planners evaluating total cost of ownership, the calculation is straightforward: non-wood composite panels carry a higher per-square-meter material cost than OSB SIPs, but they eliminate the cycle of joint resealing, mold remediation, and premature panel replacement that plagues wood-faced installations in humid or corrosive environments. When lifecycle energy savings of 60% or more are factored in, as documented by DOE testing on airtight panel construction, the payback period justifies the specification change within 3 to 5 years for most commercial applications.
Whole-Wall R-Value: Composite Panels vs Stick Framing
A 3.5-inch composite panel wall delivers a 47% higher whole-wall R-value than a standard 2×4 stick-framed wall, according to Oak Ridge National Laboratory testing. The performance gap comes down to one factor: thermal bridging elimination.
The Data: SIP Wall vs Stick Frame Thermal Performance
Procurement teams often compare insulation materials by looking at the R-value printed on a fiberglass batt. That number, however, only represents center-of-cavity performance. It ignores studs, headers, plates, and window framing. Oak Ridge National Laboratory (ORNL) conducted whole-wall R-value testing that accounts for every thermal short circuit in a real wall assembly. The results are unambiguous.
- 3.5-inch SIP wall (foam core): Whole-wall R-value of 14.09
- 2×4 stick-framed wall (R-11 fiberglass batt): Whole-wall R-value of 9.58
- Performance advantage: 47% higher effective thermal resistance for the composite panel
This is not a marginal improvement. A 47% gain in whole-wall R-value translates directly to reduced heating and cooling loads, smaller HVAC equipment specifications, and lower annual energy expenditures for the building owner. For commercial projects governed by ASHRAE 90.1 or IECC compliance, this margin often determines whether a wall assembly passes code on the first submission.
Why Whole-Wall R-Value Is the Only Reliable Metric
Component R-value, sometimes called nominal R-value, measures insulation performance at the center of a cavity. It assumes zero framing members, zero fasteners, and zero gaps. No real wall operates under those conditions. A standard 2×4 wood-framed wall has studs every 16 inches. Each stud has an R-value of roughly 1.25 per inch. Wood is a thermal conductor relative to foam. Heat migrates through studs far faster than through the adjacent insulation, creating repeating thermal bridges across the entire wall surface.
Whole-wall R-value corrects for this. It factors in framing percentage, thermal bridging at all structural members, air leakage at joints, and insulation compression around wiring and plumbing. ORNL developed the whole-wall R-value methodology specifically because component ratings were producing buildings that underperformed their design specifications by 15 to 30 percent. When a procurement engineer evaluates two wall systems for thermal performance, whole-wall R-value is the only apples-to-apples comparison available.
ORNL Findings: Thermal Bridging and the Performance Penalty
The Oak Ridge National Laboratory research, conducted under the U.S. Department of Energy’s Building America program, revealed that thermal bridging in standard stick-framed walls reduces effective R-value by 20 to 30 percent compared to the nominal cavity insulation rating. A wall built with R-13 fiberglass batts may only perform at R-9.5 once studs, headers, and corners are factored in. This is the gap that catches project teams off guard during energy modeling.
Composite sandwich panels eliminate thermal bridging at the structural level. The continuous foam core, whether XPS (0.029-0.035 W/mK), PU (0.022-0.028 W/mK), or PET (0.030-0.035 W/mK), spans the entire panel without interruption. There are no studs. There are no cavities.
The facing materials, such as GRP/FRP or aluminum skins, bond to the core as continuous membranes. Heat has no preferential conduction path through the wall cross-section. The result is a whole-wall R-value that closely matches the center-of-panel R-value, with minimal degradation.
Understanding Thermal Bridging Through Wall Cross-Sections
Visualizing thermal bridging requires looking at a wall cross-section under infrared conditions. In a stick-framed wall, an infrared thermograph shows a clear repeating pattern: cooler surface temperatures at each stud location and warmer temperatures at the insulated cavities.
This “striping” pattern is visible evidence of heat bypassing the insulation and conducting through the wood. In cold climates, these stud locations also become condensation risk zones, where interior moisture condenses on the cooler surface, potentially leading to mold growth behind the drywall over time.
A composite panel cross-section shows the inverse. The infrared thermograph displays a uniform surface temperature across the entire panel face. There are no thermal anomalies, no striping patterns, and no localized cold spots. The continuous core material provides uninterrupted thermal resistance from one edge of the panel to the other. For industrial facility planners designing cold storage or controlled-environment spaces, this thermal uniformity is what prevents condensation, ice formation, and the associated structural degradation at wall penetrations and panel joints.
The practical takeaway for specification writers is straightforward: if your energy model uses nominal R-values for stick-framed walls, your building will underperform in operation. If your energy model uses whole-wall R-values for composite panels, the modeled performance and the actual performance will align closely. This predictability is what makes composite sandwich panels a lower-risk specification for projects where energy code compliance and operational cost control are non-negotiable.
Airtightness Ratings and HVAC Cost Impact
U.S. Department of Energy testing confirms SIP structures achieve roughly 15 times the airtightness of conventional stick framing. That single metric drives both HVAC equipment downsizing and long-term operating cost reductions in commercial builds.
DOE-Validated Airtightness: The 15x Gap
The U.S. Department of Energy has documented that structural insulated panel buildings are approximately 15 times more airtight than stick-framed structures. The core reason is geometric simplicity: large-format panels (up to 8 ft × 24 ft) replace hundreds of individual studs, plates, and blocking members.
Fewer joints mean fewer leakage paths. A SIP building envelope has significantly fewer complicated interfaces between conditioned and unconditioned spaces, making it far easier to achieve and maintain a tight seal over the building’s service life.
This airtightness advantage compounds when non-wood facing materials replace OSB. Our FRP and CFRT foam core sandwich panels eliminate the dimensional instability of wood-based facings, which expand and contract with moisture cycling. Factory-bonded facings with 0.5mm thickness tolerances produce panel joints that seal more predictably than site-assembled framing, especially in high-humidity commercial environments like cold rooms and agricultural facilities.
Air Leakage and Heat Loss: The 40% Factor
Air infiltration accounts for up to 40% of total heat loss in conventionally framed commercial buildings. This is not heat conducting through the wall assembly. It is conditioned air physically escaping through gaps around studs, outlets, window rough openings, and top plates. Fiberglass batt insulation does not stop air movement; it filters it. In contrast, the continuous foam core inside a SIP panel has no voids, and the rigid facing skins create an inherent air barrier when joints are properly sealed.
For industrial facility planners specifying cold storage or temperature-controlled processing spaces, this distinction is critical. A PU foam core sandwich panel with a thermal conductivity of 0.022–0.028 W/mK, combined with the airtight joint system inherent to panelized construction, addresses both conductive and convective heat loss in a single assembly. That dual-layer protection is something stick framing with cavity insulation cannot replicate.
HVAC Equipment Downsizing: 15–30% Mechanical Cost Reduction
Airtightness directly determines HVAC equipment sizing. When a building envelope leaks less air, the heating and cooling loads calculated for that structure drop. In commercial builds using structural insulated panels, mechanical engineers consistently specify smaller HVAC systems, typically 15–30% less capacity than equivalent stick-framed structures require. This reduction applies to air handlers, ductwork, compressors, and associated electrical infrastructure.
The financial impact is immediate. Mechanical equipment is priced by capacity. A 25% reduction in tonnage or BTU rating translates directly to lower equipment purchase costs, reduced ductwork material, smaller electrical service requirements, and faster mechanical installation time. For procurement officers managing project budgets, this is a tangible offset against the higher per-square-meter material cost of composite panels versus conventional framing.
Airtightness Comparison: ACH50, HVAC Cost, and Moisture Risk
The following data summarizes how building envelope type affects measured airtightness, annual HVAC operating cost, and moisture-related risk. ACH50 is the standard blower door test metric: air changes per hour at 50 Pascals of pressure differential.
- Conventional Stick Framing (2×4 studs, fiberglass batts): 5.0–10.0 ACH50. Annual HVAC cost: $18–$26/sqm. Moisture risk: high, as airborne moisture infiltrates through multiple joint locations, promoting condensation within wall cavities.
- Wood-Faced SIP (OSB + EPS core): 0.5–1.5 ACH50. Annual HVAC cost: $8–$14/sqm. Moisture risk: moderate, as panel joints are sealed but OSB facing is susceptible to moisture wicking if seals degrade.
- FRP/CFRT Foam Core Sandwich Panel (Rax Panel construction): 0.3–1.0 ACH50. Annual HVAC cost: $6–$11/sqm. Moisture risk: low, as non-wood facings do not absorb moisture, eliminating the delamination and rot pathways present in OSB-based panels.
The moisture risk column is not incidental. For commercial construction procurement officers evaluating 10-year operating cost projections, condensation inside wall assemblies drives warranty claims, remediation costs, and thermal performance degradation. A panel system that maintains its airtightness rating over time because its facings do not degrade in humid conditions delivers more predictable lifecycle performance than one relying on wood-based skins.
The HVAC cost figures above represent generalized commercial building data compiled from DOE field studies and industry benchmarks. Actual costs vary by climate zone, building usage profile, and local energy rates. However, the relative ranking is consistent: reduced air leakage lowers operating costs, and non-wood composite panels sustain that reduction longer because the facing material does not introduce moisture-driven degradation risk.
| Performance Metric | SIP Panel System | Conventional Stick Frame | Measured Impact | Data Source |
|---|---|---|---|---|
| Airtightness (ACH50) | Up to 15x tighter than stick framing | Baseline (higher leakage) | Drastically reduced conditioned air loss | U.S. Department of Energy Testing |
| Whole-Wall R-Value (3.5″ wall) | R-14.09 | R-9.58 (2×4 with fiberglass) | 47% thermal performance improvement | Oak Ridge National Laboratory (ORNL) |
| Heating & Cooling Energy Demand | 40–60% reduction vs. conventional | Baseline energy consumption | Lower operating costs from day one | SIPA / ORNL Field Studies |
| Average Annual Energy Cost Savings | $600–$1,200/year ($50–$100/month) | Standard utility expenditure | Immediate positive cash flow for financed builds | Structural Insulated Panel Association |
| HVAC Equipment Sizing | Reduced tonnage capacity required | Oversized to compensate for air leakage | Lower equipment purchase and maintenance costs | ORNL Comparative Analysis |
| Lifecycle Energy Payback Period | 2.7 to 5.1 years | No incremental payback | 9.9x energy savings over energy invested (50-year lifecycle) | Lifecycle Assessment Studies |
| Thermal Conductivity Range (PU Foam Core) | 0.022–0.028 W/mK | Fiberglass batts: ~0.040 W/mK | Superior insulation per unit thickness | Rax Panel Technical Specifications |
| Continuous Insulation Coverage | Full panel envelope, no studs bridging | Studs every 16″ or 24″ create thermal bridges | Eliminates thermal bridging energy loss | Building Science Corporation |
Core Material Thermal Performance Breakdown
Core material selection accounts for over 80% of a sandwich panel’s thermal resistance. Specifying the wrong foam or honeycomb core can shift operating energy costs by 40-60% across a facility’s lifecycle.
Insulation Core Thermal Conductivity Comparison
Not all foam cores perform equally, even when panel thickness is identical. Thermal conductivity (measured in W/mK) is the primary specification engineers use to model envelope performance. Lower values indicate less heat transfer through the material.
The gap between the highest-performing PU foam and standard EPS is nearly 40%, which compounds significantly across thousands of square meters of cold storage or conditioned commercial space. Below are the thermal conductivity ranges, typical densities, and fire classification capabilities for the core materials we configure at Rax Panel.
- EPS (Expanded Polystyrene): 0.031–0.038 W/mK. Density 15–30 kg/m³. Fire rating: Class B–C with flame retardant additives. Most cost-effective core for standard building envelopes. EPS production uses 24% less energy than fiberglass insulation at equivalent R-value, according to the 2023 EPS Industry Alliance Environmental Product Declaration.
- GPS (Graphite Polystyrene): ~0.030 W/mK. Density 15–30 kg/m³. Fire rating: Class B with additives. Infrared-reflective graphite particles enhance thermal resistance by 20% or more over standard EPS at the same thickness, reducing panel depth requirements for code compliance.
- PU (Polyurethane Foam): 0.022–0.028 W/mK. Density 30–50 kg/m³. Fire rating: Class B achievable with fire retardant grades. Highest thermal performance among conventional foam cores. Preferred for cold chain and refrigerated applications where minimizing wall thickness maximizes usable interior volume.
- PET (Polyethylene Terephthalate): 0.030–0.035 W/mK. Density 60–150 kg/m³. Fire rating: Class B–C. Closed-cell structure provides consistent thermal performance with strong dimensional stability and zero off-gassing. Fully recyclable core option for projects requiring environmental certification credits.
- XPS (Extruded Polystyrene): 0.029–0.035 W/mK. Density 25–45 kg/m³. Fire rating: Class B with additives. Superior moisture resistance compared to EPS, making it viable for below-grade or high-humidity applications where water absorption would degrade thermal performance over time.
- PVC (Polyvinyl Chloride Foam): 0.030–0.040 W/mK. Density 50–100 kg/m³. Fire rating: Self-extinguishing, Class B achievable. Closed-cell structure with inherent flame retardancy. Commonly specified in marine and vessel applications where both thermal and fire performance are regulated.
- PP Honeycomb: 0.050–0.100 W/mK (depending on cell geometry). Density 40–120 kg/m³. Fire rating: Requires fire-rated facing to achieve Class B. Thermoplastic honeycomb provides high strength-to-weight ratio but higher thermal conductivity than foam cores. Best suited for structural applications where thermal performance is secondary to load-bearing requirements.
- Mineral Wool (Rockwool): 0.034–0.038 W/mK. Density 50–150 kg/m³. Fire rating: Class A (non-combustible). The only core option listed here that achieves the highest fire classification without additional facings. Thermal conductivity is moderate, but it is specified when fire code compliance is the primary driver: partition walls, escape routes, and industrial facilities with ignition source risks.
GPS: Enhancing R-Value by 20% Over Standard EPS
GPS (Graphite Polystyrene) is an engineered upgrade to conventional EPS that incorporates microscopic graphite particles into the foam matrix. These particles reflect infrared radiation, slowing radiative heat transfer through the panel. The result is a measured R-value improvement of 20% or more at identical density and thickness compared to standard white EPS. For procurement teams evaluating envelope specifications, this means a 100mm GPS core panel delivers thermal resistance roughly equivalent to a 120mm EPS core panel.
The practical advantage is straightforward: thinner panels achieve the same energy code compliance, which translates to marginally more interior floor space and slightly lower material shipping costs per square meter of coverage. GPS core production carries a modest cost premium over standard EPS, but the material cost delta is typically recovered through reduced panel thickness and associated logistics savings on large commercial orders.
Cold Room Panel Selection: PU vs PET vs XPS at -20°C to +40°C
Cold room and refrigerated facility specifications demand precise core selection because operating temperature differentials between interior and exterior surfaces can exceed 60°C. At these extremes, condensation risk, thermal stability, and long-term moisture resistance become critical selection criteria alongside raw thermal conductivity.
- PU Foam Core (0.022–0.028 W/mK): The established standard for cold rooms operating at -20°C and below. Its low thermal conductivity allows thinner panels to maintain the required temperature differential, maximizing usable cold storage volume. PU foam maintains stable thermal performance across the full -40°C to +80°C range. Condensation risk is minimized when panel joints are properly sealed, as the closed-cell structure does not absorb moisture.
- PET Foam Core (0.030–0.035 W/mK): A viable alternative when fire certification or environmental documentation is required alongside thermal performance. PET operates reliably from -40°C to +100°C with negligible off-gassing. Its higher density provides superior dimensional stability under mechanical load, relevant for freezer floors or panels supporting shelving systems. However, the higher thermal conductivity compared to PU means thicker panels are required to achieve equivalent thermal resistance at -20°C, which increases wall depth and material volume.
- XPS Foam Core (0.029–0.035 W/mK): The strongest option for moisture-heavy or high-humidity cold environments. XPS absorbs less than 0.3% water by volume, compared to 1.0–3.0% for EPS. In cold rooms where exterior humidity is high and dew point management is critical, XPS resists thermal degradation from moisture ingress better than most alternatives. Thermal conductivity sits between PET and PU, requiring intermediate panel thickness for -20°C compliance.
Our engineering team configures cold room panels based on three variables: target interior temperature, ambient exterior conditions, and facing material. For standard freezer applications at -20°C with exterior temperatures up to +40°C, PU core panels with GRP or CFRT facings in 100–150mm thickness provide the most reliable thermal envelope with minimal condensation risk at joint lines.
When project specifications require fire-rated panels or green certification, we shift to PET or mineral wool cores and adjust thickness accordingly to maintain the required thermal resistance.
| Core Material | Thermal Conductivity (W/mK) | R-Value per Inch | Primary Advantage |
|---|---|---|---|
| PU Foam | 0.022 – 0.028 | 5.6 – 7.0 | Superior thermal resistance; ideal for cold rooms and refrigerated transport at -20°C |
| XPS Foam | 0.029 – 0.035 | 4.0 – 4.9 | High compressive strength and moisture resistance for below-grade and wall applications |
| PET Foam | 0.030 – 0.035 | 4.0 – 4.7 | Recyclable and dimensionally stable; 24% less embodied energy than equivalent fiberglass insulation |
| EPS Foam | 0.031 – 0.038 | 3.8 – 4.4 | Cost-effective continuous insulation with established ORNL/DOE validated whole-wall performance data |
| PVC Foam | 0.030 – 0.038 | 3.8 – 4.7 | Inherent fire-retardant properties combined with closed-cell waterproof structure for marine use |
| PMI Foam | 0.018 – 0.025 | 6.0 – 8.0 | Aerospace-grade thermal performance with exceptional shear strength-to-weight ratio |
| Rockwool (Mineral Wool) | 0.034 – 0.038 | 3.7 – 4.2 | Non-combustible Class A fire rating achieving strict ASHRAE/IECC code compliance |
| PP Honeycomb | 0.050 – 0.080 | 1.8 – 2.9 | Maximum structural strength-to-weight ratio where load-bearing capacity outweighs thermal priority |
Facing Material Selection and Structural Load
Facing material dictates structural span, dead load, and fire compliance more than core choice. Selecting the wrong skin for a moisture-heavy or high-span application triggers costly remediation within 3-5 years.
Weight-to-Strength Ratios by Facing Type
The facing material you specify controls two critical procurement variables: dead load on the supporting structure and maximum unsupported span before deflection exceeds L/240. Our production line manufactures panels with five primary facing types, each serving distinct structural profiles.
FRP (fiberglass reinforced plastic) sheets deliver a tensile strength exceeding 200 MPa while maintaining a density roughly 70% lower than steel. This makes FRP-faced panels the default choice for refrigerated truck bodies and marine vessels where every kilogram directly impacts payload capacity or fuel consumption.
CFRT (continuous fiberglass reinforced thermoplastic) sheets push the weight-to-strength ratio even further. CFRT offers a specific strength approximately five times that of steel, meaning it carries comparable loads at a fraction of the weight. For commercial construction procurement officers evaluating building envelope panels, CFRT facings allow longer spans between structural supports, reducing both steel framing costs and installation labor. The thermoplastic matrix also makes CFRT fully recyclable, which simplifies LEED material credit documentation.
Aluminum and ACP (aluminum composite panel) facings occupy the middle ground. They provide excellent flatness and weather resistance for exterior wall cladding applications but lack the impact toughness of FRP or CFRT. Stainless steel facings, while heavier, deliver superior hygiene performance for food processing facilities and pharmaceutical cleanrooms where surface contamination risk outweighs weight concerns. Aluzinc-coated steel offers a cost compromise, providing corrosion resistance approaching stainless steel at roughly 60% of the material cost.
Span Capability and Load-Bearing Data
Facing thickness and material stiffness directly determine the maximum clear span a sandwich panel can achieve without intermediate supports. In our engineering tests, a 100mm-thick PU foam core panel with 2.0mm FRP facings achieves a maximum span of approximately 4.2 meters under a uniform live load of 0.75 kN/m² while maintaining deflection within L/200. Switching to 0.8mm aluminum facings on the same core reduces that span to roughly 3.1 meters under identical loading conditions.
For industrial facility planners specifying cold room envelopes, these span differences translate directly into structural steel tonnage. Longer spans mean fewer interior columns, simpler forklift traffic flow, and reduced foundation costs. Our engineering team runs finite element analysis on each project specification to validate span performance against actual load requirements, including point loads from suspended equipment and seismic conditions where applicable.
- FRP facings: Best span performance per unit weight; ideal for RV walls, truck bodies, and marine bulkheads
- CFRT facings: Highest specific strength; suited for long-span building envelopes and aviation applications
- Aluminum facings: Moderate span, excellent weatherability; standard for exterior cladding systems
- Stainless steel facings: Lower span-to-weight but unmatched hygiene; required in food and pharmaceutical facilities
- ACP facings: Aesthetic finish with moderate structural capacity; common in architectural facades
Fire Rating Compliance for Commercial Projects
Fire rating is where many panel specifications fail during building code review. The facing material alone does not determine fire classification; it is the complete assembly of facing, core, and adhesive that must pass standardized tests such as ASTM E84, EN 13501-1, or GB 8624.
Standard foam cores like EPS, PU, and PET typically achieve a Class B or C fire rating when combined with FRP or aluminum facings. For projects requiring Class A fire ratings, such as hospitals, high-rise offices, and public assembly buildings, you must specify either mineral wool (rock wool) cores or specialized fire-rated facing systems.
Our manufacturing line produces Rockwool Sandwich Panels and PUR/PIR Sandwich Panels specifically for fire-sensitive applications. PIR (polyisocyanurate) cores offer improved fire resistance compared to standard PU, achieving higher ignition temperatures and lower smoke generation. When combined with fire-rated steel or Aluzinc facings, these panels can meet the stringent requirements of IECC and ASHRAE compliance for commercial building envelopes.
For international distributors importing panels into jurisdictions with aggressive fire codes, we provide full fire test documentation with each shipment. This includes chamber test results, smoke density ratings, and toxic gas emission data. Procurement officers should verify the specific fire standard their local authority requires before finalizing facing and core specifications, as substituting a Class B panel into a Class A application will trigger a failed inspection and costly replacement.
| Facing Material | Tensile Strength | Key Properties | Recommended Application |
|---|---|---|---|
| GRP/FRP | >200 MPa | Waterproof, gelcoat option, corrosion-resistant | Cold rooms, marine vessels, agricultural buildings |
| CFRT | 5x steel (specific strength) | Lighter, thinner, high resilience, thermoplastic | Vehicle manufacturing, structural spans, building envelope |
| Aluminum | Moderate-to-high load | Lightweight structural span, corrosion-resistant | Exterior wall cladding, mobile homes, roofing |
| Stainless Steel | Heavy-duty structural load | Hygiene-grade surface, fire-rated, chemical-resistant | Industrial facilities, food processing, medical |
| Steel / Aluzinc | Maximum structural load | Fire-rated, impact-resistant, durable | Industrial equipment, heavy construction |
| ACP | Moderate structural load | Aesthetic finish, flat surface, lightweight | Architectural facades, exterior wall cladding |
| Plywood | Moderate structural load | Impact-resistant, economical, field-workable | RV furniture panels, mobile home interiors |
| PVC | Low-to-moderate load | Chemical-resistant, waterproof, easy to clean | Chemical storage, agricultural buildings, wet zones |
Energy Payback Period and Lifecycle Cost
Structural insulated panels deliver energy savings 9.9 times greater than the energy invested in their manufacture over a 50-year lifecycle, with full energy payback achieved in as few as 2.7 years in warm climates.
50-Year Lifecycle Energy Analysis
The embedded energy in a composite panel, covering raw material extraction, core expansion, facing lamination, and transport, is substantial. But that upfront energy cost is recovered quickly when the panel goes into service. Over a 50-year building lifecycle, the thermal energy saved by continuous insulation panels runs 9.9 times higher than the total energy required to manufacture and deliver them.
This ratio holds true across most core configurations. EPS core production, for example, consumes 24% less energy than fiberglass insulation manufacturing at equivalent R-value, according to the 2023 EPS Industry Alliance Environmental Product Declaration. PU and PET foam cores follow similar efficiency curves, with the added benefit of lower thermal conductivity (0.022–0.028 W/mK for PU) reducing the energy demand during the operational phase even further.
For procurement teams evaluating wholesale structural insulated panel suppliers, this lifecycle ratio matters because it directly affects green building certification points. LEED v4.1 and BREEAM both reward materials with documented energy payback ratios exceeding 5:1 over the building service life.
Energy Payback Periods by Climate Zone
Energy payback refers to the time it takes for a panel’s operational energy savings to equal the energy consumed during its production. The math changes significantly depending on heating and cooling degree days at the installation site.
- Warm climates (ASHRAE Climate Zones 1–3): Payback in approximately 2.7 years. High cooling demands and minimal heating loads mean the panel’s thermal resistance immediately reduces HVAC runtime.
- Mixed/average climates (Zones 4–5): Payback in approximately 5.1 years. Seasonal variation extends the recovery period, but the 60%+ reduction in heating and cooling energy still delivers fast returns.
- Cold climates (Zones 6–7): Payback typically falls between 3.5 and 4.8 years. Despite longer heating seasons, the high R-value per inch of PU and XPS cores accelerates recovery compared to conventional insulation.
These figures assume standard building operating schedules. Industrial facilities running continuous processes, cold storage at -20°C for instance, often see payback periods under 2 years because the energy delta between insulated and uninsulated envelopes is far more extreme.
Greenhouse Gas Emission Offset Timeline
The carbon footprint of composite panel production is front-loaded. Foam expansion, facing material extrusion, and adhesive curing all generate emissions before the panel leaves the factory. However, once installed, the reduction in HVAC-related emissions begins accumulating immediately.
On average, structural insulated panels offset their manufacturing greenhouse gas emissions within 3.8 years of installation. After that point, every additional year of service represents net-negative carbon contribution compared to a conventional construction baseline. Over the full 50-year lifecycle, a SIP building envelope prevents roughly 9.9 times the greenhouse gas emissions that were required to produce it.
For international building materials distributors serving markets with carbon pricing mechanisms, the EU Emissions Trading System for example, this data point carries direct financial weight. Buildings that demonstrably reduce operational carbon face lower compliance costs and higher asset valuations.
ROI Calculation Framework for Procurement Officers
Quantifying the return on composite panel investment requires a structured approach that accounts for material cost, installation efficiency, and long-term energy expenditure. The following framework is designed for commercial construction procurement and industrial facility planning teams evaluating SIPs against conventional building methods.
- Step 1. Baseline energy cost: Calculate the current annual HVAC energy cost per square meter for the building type using conventional construction. Use local utility rates and ASHRAE 90.1 compliance as the reference baseline.
- Step 2. Projected energy reduction: Apply the documented 60% minimum reduction in heating and cooling energy demand for SIP-constructed envelopes. For cold room or industrial process environments with PU foam core panels (0.022–0.028 W/mK thermal conductivity), the reduction can exceed 70%.
- Step 3. Material cost delta: Subtract the cost of conventional framing materials (lumber, batt insulation, vapor barriers, sheathing) from the composite panel cost per square meter delivered to site. Include freight and crating for international shipments.
- Step 4. Labor and timeline savings: Factor in the 30–55% reduction in framing labor and shorter construction timelines. For projects with construction loan interest, every week of timeline reduction translates to measurable financing cost savings.
- Step 5. Payback calculation: Divide the material cost delta (Step 3 minus Step 4 savings) by the annual energy savings (Step 1 minus Step 2). This yields the simple payback period in years.
- Step 6. 10-year operating cost projection: Multiply the annual energy savings by 10, then subtract any projected maintenance costs. Compare this against the 10-year operating cost for the conventional baseline. Present this figure alongside total project cost per square meter for stakeholder review.
We have applied this framework across cold storage, commercial wall cladding, and mobile home envelope projects at Rax Panel. In most scenarios, the simple payback falls between 3 and 6 years, with 10-year net savings ranging from 40% to 65% compared to conventional construction operating costs. The exact numbers depend on local energy prices, climate zone, and core material selection: PU cores for thermal-critical applications, PET or XPS for balanced performance and cost efficiency.
Procurement officers should also account for mechanical system downsizing. Because composite panel envelopes reduce air infiltration by up to 15 times compared to stick framing (per U.S. DOE testing), HVAC equipment can often be sized 15–30% smaller. That reduction in upfront mechanical cost frequently offsets a significant portion of the panel material premium before energy savings even enter the calculation.
| Metric | Value | Benchmark Context | Advantage |
|---|---|---|---|
| Energy Payback Period | 2.7 – 5.1 years | SIPs vs conventional construction lifecycle | Rapid ROI on higher upfront material cost |
| 50-Year Energy ROI Ratio | 9.9x energy saved vs energy invested | ORNL whole-building lifecycle analysis | Validates long-term specification for code compliance |
| Heating & Cooling Demand Reduction | ≥ 60% | SIPs vs stick-framed buildings (DOE testing) | Directly lowers 10-year operating cost projections |
| Annual Energy Cost Savings | $600 – $1,200/year | Based on $50–$100/month savings (SIPA data) | Offsets mortgage cost differential from day one |
| HVAC System Downsizing | 30 – 40% capacity reduction | ORNL confirmed 40% consumption drop | Reduces upfront mechanical equipment CapEx |
| Construction Waste Reduction | Up to 66% | Factory-precision SIPs vs on-site stick framing | Lowers disposal costs and supports LEED credits |
| Framing Labor Reduction | Up to 55% | BASF / RSMeans comparative study | Compensates for higher panel material unit cost |
| EPS Core Embodied Energy | 24% less than fiberglass insulation | Equivalent R-value (2023 EPS Industry Alliance EPD) | Improves whole-project environmental profile |
Installation Speed and Labor Cost Reduction
Prefabricated composite panels cut framing labor by 30–55% and reduce on-site waste by up to two-thirds, translating directly to lower project overhead and faster building enclosure timelines.
Framing Time Reduction: 30–55% Faster Than Stick Framing
A study conducted by BASF and RSMeans Business Solutions found that structural insulated panels reduce framing labor by up to 55% compared to traditional stick framing methods. The speed advantage comes from a fundamentally different workflow: panels arrive on-site pre-cut to specification, labeled, and ready for installation rather than requiring individual studs to be measured, cut, nailed, and insulated in sequence.
For commercial construction procurement teams, this compression in the framing phase has cascading financial implications. Faster enclosure means interior trades can begin work sooner, shortening the overall critical path. Shorter build timelines reduce general conditions costs, since temporary fencing, portable toilets, site security, and supervision overhead accrue daily regardless of progress. On multi-unit or repetitive structures, the time savings compound across the entire project portfolio.
Our production line at Rax Panel outputs over 1,700 square meters of composite panels per day. At that volume, even large commercial envelopes can be manufactured and staged for shipment within days, not weeks. The bottleneck shifts from material availability to site readiness, a variable that project managers can control.
Factory-Precision Manufacturing Eliminates On-Site Cutting Waste
Traditional stick framing generates significant on-site waste: offcuts of lumber, discarded insulation batts, and scrap sheathing that never make it into the building. Industry data consistently shows that SIP construction reduces jobsite waste by up to two-thirds because panels are fabricated to exact dimensions in a controlled factory environment.
Waste reduction matters beyond disposal fees. On constrained urban sites, material staging space is limited. Every panel that arrives pre-sized means less on-site cutting, less dust, less noise compliance risk, and fewer waste bins requiring haulage. For industrial facility planners managing clean-room or temperature-sensitive environments, minimizing on-site particulate generation during construction is a measurable advantage.
Rax Panel’s engineering team works directly from project drawings to generate panel shop layouts. Each panel is cut, cores are bonded to facings, and edge detailing is completed before the panel leaves the factory. What arrives on-site is an installation-ready component, not a raw material requiring further processing.
Tolerance Consistency Prevents Installation Failures
Inconsistent material dimensions are a hidden cost driver on construction sites. When studs vary by even 2–3mm, installers spend time shimming, planing, or forcing connections that should align cleanly. The cumulative effect is hours of rework that rarely appears in the original labor estimate but reliably erodes margins.
Factory-produced composite panels maintain dimensional tolerances of approximately 0.5mm in thickness. This consistency means that when panels are joined, seams align as engineered. Connection details fit. Sealant channels are the correct depth. The thermal envelope performs as designed because the physical geometry matches the specification.
For procurement officers evaluating suppliers, tolerance consistency is a proxy for manufacturing quality control. Panels that deviate from spec create cascading problems: gaps that require additional sealant, misaligned mechanical fasteners, and thermal shortcuts that compromise the whole-wall R-value the project was designed to achieve. Over a 50+ country supply chain, this consistency must hold across every shipment, not just the first sample batch.
| Feature | Specification | Data Source | Labor Impact |
|---|---|---|---|
| Construction Time Reduction | Up to 55% faster framing vs. stick framing | BASF / RSMeans Study | Accelerated project timelines; earlier interior work commencement |
| Framing Labor Reduction | Up to 55% fewer labor hours | BASF / RSMeans Study via Architect Magazine | Direct reduction in on-site labor costs and construction loan interest |
| Construction Waste Reduction | Up to 66% less material waste | U.S. DOE / Premier SIPs | Lower disposal costs; reduced on-site waste management labor |
| Panel Size (Pre-Fabricated) | Up to 8 ft × 24 ft per panel section | U.S. DOE Reporting | Fewer joints to seal; fewer pieces to handle; simplified crane-based installation |
| Manufacturing Tolerance | 0.5 mm thickness tolerance (factory-controlled) | Rax Panel Internal Standards | Eliminates on-site fitting and rework; reduced need for skilled framing carpenters |
| Daily Production Output | 1,700+ sqm/day manufacturing capacity | Rax Panel Factory Specifications | Large-scale project supply assurance; prevents delivery-delay idle labor |
| Airtightness (Installed) | 15× more airtight than stick-framed structures | U.S. DOE Testing | Reduced post-install sealing and caulking labor; fewer callback remediation visits |
| HVAC Equipment Downsizing | 40–60% heating/cooling energy demand reduction | ORNL / U.S. DOE / SIPA | Smaller HVAC units reduce mechanical installation labor and equipment cost |
Conclusion
SIPs outperform stick framing on every metric that matters for commercial construction: whole-wall R-value, airtightness, speed of assembly, and 50-year energy payback. The data from ORNL and DOE testing is unambiguous. If your project requires ASHRAE/IECC compliance and you are still specifying 2×4 stud walls with fiberglass batts, you are building in a guaranteed thermal penalty from day one.
Here is what most procurement teams miss during specification. OSB-faced panels rot in moisture-heavy environments such as cold rooms, agricultural buildings, and marine applications, because wood delaminates when exposed to sustained humidity above 80%. This is why we engineer FRP and aluminum facings bonded to PU or PET cores for those conditions.
The thermal conductivity stays locked between 0.022 and 0.035 W/mK. No thermal bridging. No hidden moisture damage eroding your R-value five years after handover. That 47% R-value advantage over stick framing only holds if the panel facing survives the environment it sits in.
Stop guessing on core selection. Send your project specs, including climate zone, internal temperature targets, and fire rating requirements, to our engineering team. We will run the thermal calculations, recommend the exact foam core and facing combination, and return a data sheet with W/mK values, thickness tolerances, and FOB pricing within 48 hours.
Frequently Asked Questions
Are there financial incentives for building with SIPs?
Yes, projects using SIPs often qualify for environmental tax benefits and green building certifications such as LEED or Net-Zero Energy. These financial incentives are available at local, state, and federal levels.
How do SIPs handle extreme weather conditions?
SIPs are engineered to withstand extreme weather, including high winds from hurricanes, tornadoes, and seismic activity. Their solid panel construction resists warping and settling, ensuring long-term structural stability.
Do SIPs lower long-term building maintenance costs?
Yes, the precision engineering of SIPs eliminates common framing issues like warped lumber, drywall cracks, and gaps. This solid construction reduces the need for ongoing repairs and lowers long-term upkeep costs.
How do SIPs improve indoor air quality?
The airtight construction of SIPs minimizes air leaks, blocking outdoor pollutants, dust, and allergens from entering the building. Controlled indoor humidity also reduces the risk of mold and mildew.
How much does sips cut energy typically cost?
The cost of sips cut energy varies based on material grade, thickness, panel dimensions, and order volume. Requesting a detailed quote with your project specifications is the most reliable way to get an accurate figure. Bulk orders typically reduce per-unit pricing significantly.